


If you’re looking for the most extensive and up-to-date list of blockchain statistics from trusted sources, all in one place and neatly sorted by popular categories, this is the only article you need!
Our blockchain stats cover the blockchain market, crypto market, NFT market, blockchain gaming, the metaverse, and much more!
Make sure to bookmark this article as I’ll be updating it frequently with fresh data. The data source is placed in parentheses at the end of each statistic or the beginning of a section.
Let’s start with blockchain market size and blockchain growth statistics for 2025 and predictions for the future.
Blockchain Market Size Statistics 2025
At first, blockchain was created to enable cryptocurrency, but now, it has so many different use cases and the power to transform entire industries. As a result of that, the blockchain market growth is rapid.
These blockchain statistics confirm that.
- The global blockchain market size in 2024 was valued at $10 billion. The blockchain market is expected to grow at an 87.7% CAGR from 2023 to 2030 and reach $1.4 trillion by 2030. This rapid blockchain growth is attributed mostly to the increasing venture capital funding. (Grand View Research)
- North America has the biggest blockchain market share. (Statista)
- The financial sector, government, healthcare, media & entertainment, and retail have the biggest blockchain market share. (Grand View Research)
- Blockchain technology is set to boost global GDP by $1.76 trillion by 2030. (Finances Online)
- Global spending on blockchain solutions will reach $19 billion by 2025. (Statista)
- Blockchain technology has facilitated the transfer of over $270 billion worth of assets. It’s worth noting that these assets aren’t limited to cryptocurrencies, but also include NFTs and other types of content and tools. (Gartner)
- 10% of the global population owns cryptocurrencies. (Statista)

Many people are wondering how widely used is blockchain and how widespread is blockchain acceptance. Here’s what Deloitte’s survey found.
- 81% of survey respondents from the financial service industry think that “blockchain technology is broadly scalable and has achieved mainstream adoption.” Furthermore, 80% think their “industry will see new revenue streams from blockchain technology.”(Deloitte)
- 76% of financial executives believe that “digital assets will be a strong alternative or replacement for fiat currencies in the next five to ten years.” (Deloitte)
- According to survey respondents who work in the financial industry, cybersecurity is the biggest obstacle to the acceptance and use of digital assets globally. (Deloitte)

Biggest Blockchains
This is a list of the largest blockchains by TLV (total value locked). These are also the most used blockchains.
Data source: Coin Market Cap
- Ethereum
- BSC
- Tron
- Arbitrum
- Polygon
- Avalanche
- Optimism
- Solana
- Phantom
- Mixin
You might also be wondering, how many blockchains are there in the world? There are more than 1,000 blockchains in 2025 across four different types of blockchain networks (public, private, consortium, and hybrid)

Blockchain Statistics: Funding and Investments
The blockchain market has seen significant growth, largely attributed to a surge in investment activity.
Gain insight into blockchain funding, top equity, and seed deals with the following blockchain statistics.
Data source: CB Insights
- In 2022, there were 1,828 deals and $26.8 billion in blockchain funding.
- In Q1 2022, blockchain funding and deals reached record numbers ($10.8 billion). However, in Q4 2022, there was a significant decline in blockchain funding ($3.2 billion).
- The United States secured the largest number of blockchain deals in 2022.
- Blockchain companies in Asia raised a record $4.7 billion of funding in 2022, which is 47% YoY growth.
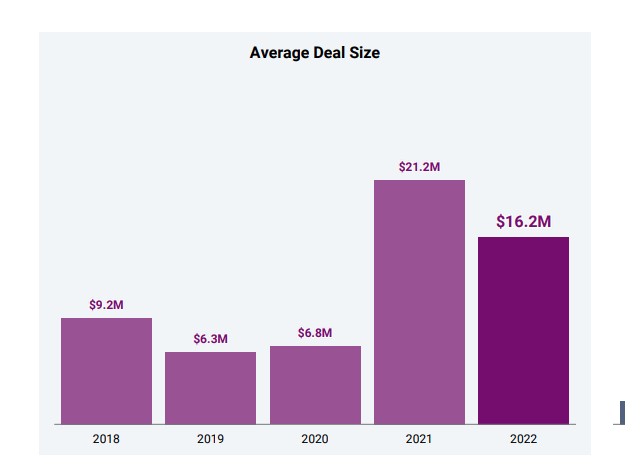
- The average blockchain deal size fell from $21.2 million in 2021 to $16.2 million in 2022.
- More than 50% of global blockchain funding in 2022 went to web3 startups, which is equal to $15.1 billion.
- NFTs, gaming, and metaverse saw record funding in 2022 – $7 billion.
- Blockchain infrastructure and development saw an 81% growth in funding in 2022.
- Crypto exchanges and wallets experienced a drop in funding by -48%, from $6.9B in 2021 to just $3.6B in 2022.
- Top blockchain investors by company count are Coinbase Ventures, Polychain Capital, Big Brain Holdings, and Circle Ventures.
- Top blockchain VCs by company count are Shima Capital, HashKey Capital, Solana Ventures, Variant Fund, and 6th Man Ventures.

Top Equity Deals
This is a list of top equity blockchain deals in Q4 2022.

Top Seed/Angel Deals
The image above represents the top seed/angel deals in Q4 2022.

Top Blockchain Unicorns
Top unicorn companies in the blockchain market were Ripple, Blockchain.com, and OpenSea with $15 billion, $14 billion, and $13 billion evaluations respectively.

Crypto Statistics 2025
Since blockchain and crypto are interconnected, I’ve also included key crypto statistics for 2025.
Crypto Market Statistics: Size and Growth
- The crypto market size was $4.67 billion in 2022. From 2023 to 2030, it is predicted to grow at a CAGR of 12.5%. (GrandView Research)
- The global cryptocurrency market cap was valued at over $800 billion in 2022. (GrandView Research)
- Binance is considered to be the biggest crypto company in the world. Other leading crypto companies include Coinbase, Grayscale, OpenSea, and Gemini Trust Company.
- Another important crypto statistic is how many crypto wallets are there in 2025. According to FinancesOnline, there are more than 89 crypto wallets available on the market. (FinancesOnline)
Cryptocurrency Users Statistics
- Another indicator of how big the crypto market is is how many people own cryptocurrency. There are more than 420 million global cryptocurrency users in 2025. (Zippia)
- The number of crypto users is predicted to reach 1 billion by 2027. (Statista)
- India, China, and the United States have the most cryptocurrency users. (Triple-A)
- When it comes to what percentage of the world owns crypto, it’s estimated that about 3% of the population is a crypto user. (Triple-A)
- About 20% of Americans own crypto – more than 50 million. (Coinbase)
- The average revenue per user in the crypto industry in 2025 is $56. (Statista)

Crypto Crime Statistics
One of the main concerns users have about crypto is scams and crimes that are rampant in the crypto community. Here are key findings from ChainPlay’s report on cryptocurrency-related crime from 2012-2022.
Data source: ChainPlay
- More than $30 billion was lost due to crypto crime in the past decade. That’s 30 times the UN’s earthquake appeal for Turkey, 20 times the cost of building the world’s tallest building, and 18 times Google’s YouTube acquisition.
- In 2022, crypto crime hit an all-time high of $12 billion stolen in 436 incidents. That’s equivalent to $1.4 million lost every hour last year due to crypto-related crime.
- June is the most dangerous month for crypto investing, with 77 crypto crime incidents and $5.7 billion stolen in the last ten years.
- 2025 has the potential to reach a new all-time high, with more than $16 billion lost due to crypto crime. By 2026, this figure could reach nearly $20 billion.
- The US was the most targeted by cryptocurrency hackers, but Turkey lost the most dollars to crypto crime.

Bitcoin Blockchain Statistics 2025
Wondering how many people own Bitcoin and why are people investing in Bitcoin?
Check out these blockchain statistics related to Bitcoin, one of the most popular cryptocurrencies in the world.
How Many People Own Bitcoin?
- The estimated number of Bitcoin users in 2025 is 106 million. The biggest number of Bitcoin users ever was in 2021. (Glassnode)
- As of now, there are about 3 million bitcoins in circulation. The maximum amount of Bitcoin that can exist is 21 million. (Bitcoin Worldwide)
- There are hundreds of thousands of Bitcoin transactions per day. (Blockchain.com)
Interest in Bitcoin Survey
Data source: Block, Inc. Survey Report 2022
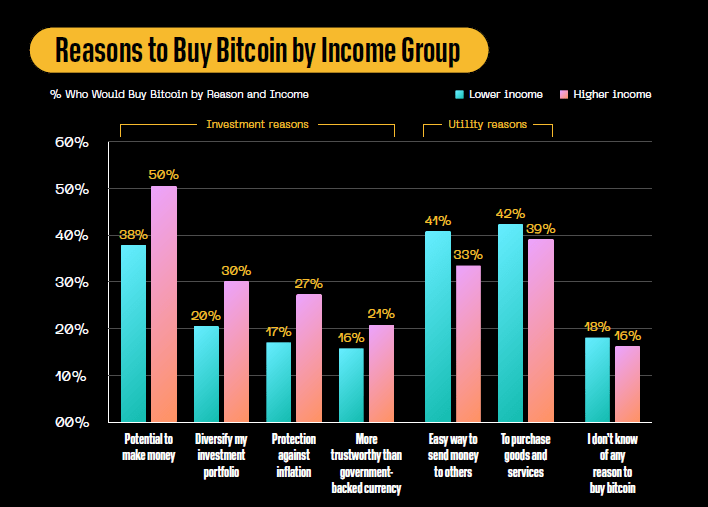
- The main reason people invest in Bitcoin is the potential to make money. More specifically, 50% of survey respondents with higher income and 38% with lower income buy Bitcoin for that reason.
- When it comes to utility reasons, easy ways of sending money to others and purchasing goods and services are at the top of the list. Interestingly, respondents with lower incomes note these reasons more frequently. Furthermore, these reasons also appeal to people from countries with lower per capita GDP and higher shares of income from remittances.
- 27% of higher-income respondents and 17% of lower-income respondents say they buy Bitcoin as protection against inflation. Furthermore, there is a correlation between a country’s inflation rate and the attitude towards Bitcoin as protection from it.
- When it comes to knowledge of Bitcoin by gender, it leans mostly toward men in the Americas. In EMEA and APAC, women tend to consider themselves experts on Bitcoin among their family and friends more than men. For example, 17% of female respondents from the EMEA region consider themselves experts and 18% consider themselves very knowledgeable, compared to just 4% and 13% of men.
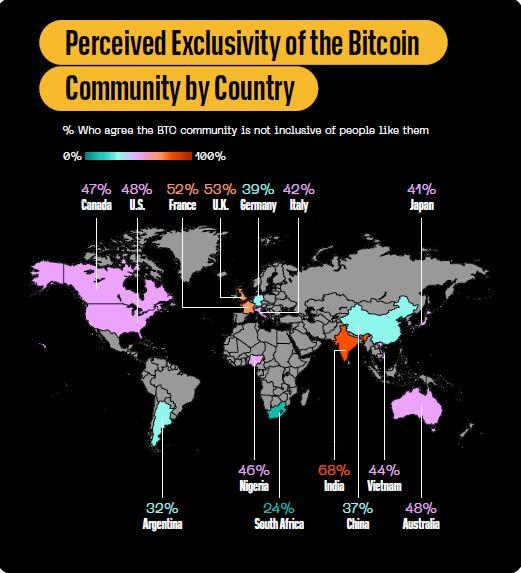
- Respondents were also asked whether they feel that the Bitcoin community is not inclusive of people like them (based on their gender, age, income, etc.). Most of them don’t feel excluded – that’s especially true for people in South Africa, Argentina, and China. However, a significant percentage of people from India (68%), the United Kingdom (53%), and France (52%) feel excluded.
- There’s a strong correlation between knowledge about Bitcoin and a positive outlook on Bitcoin and its future. For example, 41% of people who consider themselves experts on Bitcoin say they’re very likely to purchase Bitcoin in the next year. On the other hand, 47% of people with limited or no knowledge say they’re not too likely to purchase Bitcoin.
- People with higher incomes are more optimistic about Bitcoin across all regions. For example, 48% of higher-income respondents from the APAC region are optimistic about Bitcoin, compared to 39% of lower-income respondents.
- The main reasons for not buying Bitcoin are not knowing enough about it (51%), security risks (32%), price volatility (30%), uncertain regulatory outlook (29%), too expensive (27%), and not knowing where to buy it (22%).
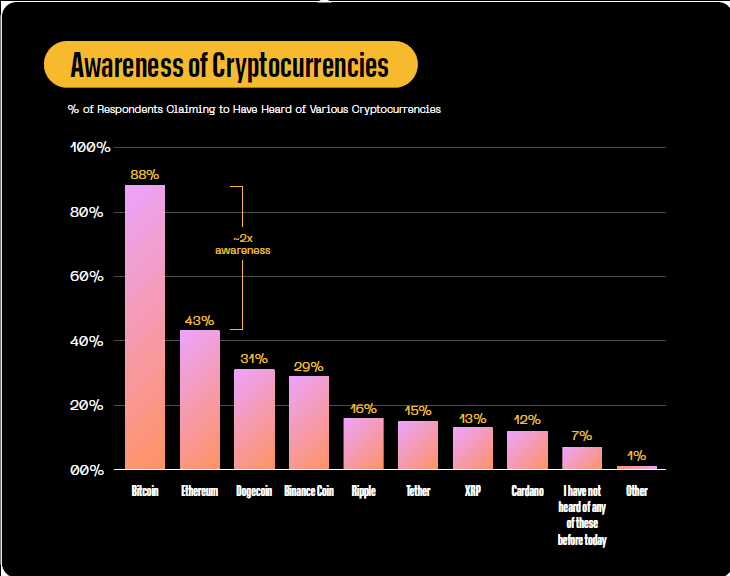
- Bitcoin awareness is higher than any other cryptocurrency. Among respondents who claim they’ve heard about various cryptocurrencies, 88% of them heard about Bitcoin, while only 43% of them heard about Ethereum.
Ethereum Statistics 2025
How many people own Ethereum?
- More than 230 million own Ethereum. That number is up more than 18% compared to one year ago. (Ycharts)

NFT Statistics 2025
Some love them, and some hate them, but what is sure is that NFTs are a huge part of the blockchain and crypto industry.
Here are NFT stats you need to know including NFT market statistics, NFT popularity, NFT demographics, top NFTs, and more!
NFT Market Statistics
- NFT market revenue reached $892 million worldwide in 2022. It will reach $1.6 billion by the end of 2025. (Statista)
- By 2027, the NFT market will surpass $3.1 billion in revenue and is expected to have an annual growth rate (CAGR 2023-2027) of 18.55%. (Statista)
- A global research firm VMR, however, predicts much bigger and faster growth of the NFT market value – $231 billion by 2030. (VMR)
- The average revenue per user (ARPU) in the NFT market is $114 in 2023. (Statista)
- There are 14 million NFT users. The number of NFT users will grow to 19 million by 2027. (Statista)
- By 2025, user penetration in the NFT market is projected to reach 0.2%, and it is forecasted to remain the same by 2027. (Statista)
NFT Popularity
You might be wondering, are NFTs still popular? Many think that NFT interest over time is declining. However, data shows that NFTs are still popular in 2023.
- According to the analysis of user NFT tweets, NFT interest is highest in the following countries: Montenegro, Bosnia and Herzegovina, Luxemburg, Cuba, Curacao, Taiwan, Columbia, France, Lebanon, and Vietnam. NFTs are disliked the most in the following countries – Poland, Nicaragua, Belize, Trinidad and Tobago, Barbados, Mauritius, Kyrgyzstan, Jamaica, Ireland, and Kosovo. (CashNetUsa)
- According to inhabitants’ Google searches, countries with the highest NFT interest are Singapore, Hong Kong, Canada, Iceland, and the United States. (CashNetUsa)

NFT Demographics
- Based on the data collected from Morning Consult’s study, it was found that millennials make up the largest group of NFT collectors at 23%. (Morning Consult)
- In contrast, the percentage of NFT collectors among other generations is significantly lower, with only 8% of Gen Xers, 4% of Gen Zers, and 2% of Baby Boomers admitting to collecting NFTs. (Morning Consult)
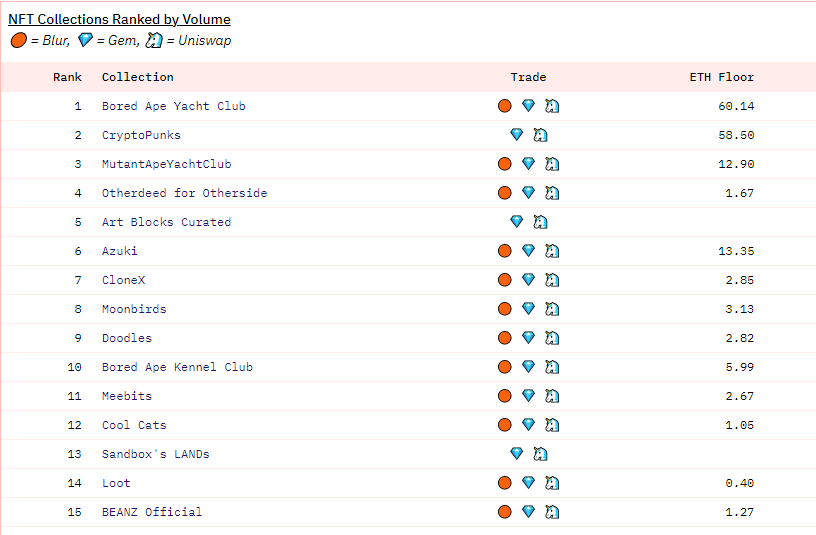
Most Popular NFT Collections
These are the most popular NFTs by all-time volume.
Data source: Dune
- Bored Ape Yacht Club
- CryptoPunks
- Mutant Ape Yacht Club
- Otherdeed for the Otherside
- Art Blocks Curated
- Azuki
- Clone X – Takashi Murakimi
- Moonbirds
- Doodles
- Bored Ape Kennel Club
Biggest NFT Marketplace
There are many great marketplaces for trading NFTs, but these are the biggest NFT marketplaces by market share in 2025.
Data source: CoinGecko
- Blur
- OpenSea
- X2Y2
- Magic Eden
- LooksRare
How Many People Own NFTs?
- There are more than 360,000 NFT owners in 2025. (Financial Times)
- If we look at NFT users by country, the majority of them live in Thailand, Brazil, the United States, China, Vietnam, India, and Canada.
NFT Sales Statistics
- Around 19 thousand NFTs are sold per day (The Wall Street Journal)
- Around a quarter of a million people trade NFTs each month on the popular NFT marketplace OpenSea. (OpenSea)
- It is predicted the average NFT price will reach $0.029556 as the market starts to recover. (Bitnation)
- More than half of NFT sales don’t reach $200. (Chainalysis)

Blockchain Gaming Statistics 2025
Many people in the gaming industry are wondering if blockchain good for gaming and what is the potential of blockchain gaming. While this market is still young, it’s showing a lot of promise.
The following statistics demonstrate how big is the blockchain gaming industry and how it affects other markets.
Data source: DappRadar, Grand View Research

Blockchain Gaming Market Size
- The blockchain gaming industry was valued at $4.6 billion in 2022.
- During the first quarter of 2024, there was a noticeable positive trend in the blockchain gaming industry as it experienced a bullish growth of 45.60% in dominance over other categories. This was a significant increase compared to the previous quarter, where the industry had a 42.87% dominance.
- Wax was the most popular gaming blockchain of 2022 with more than 350,000 unique active wallets.
- Aside from Wax, other leading gaming blockchains by the number of UAW in 2022 were: Hive, BNB Chain, Polygon, Ronin, EOS, Dep, Flow, and IMX.
Number of Blockchain Gamers
- In Q1 2023, there were almost 800,000 blockchain gamers. That’s 8.58% less than in the previous quarter.
- In 2022, there were 37 million blockchain gamers – 50% more than in 2021.

Top Blockchain Games
These are the leading blockchain games:
- Alien Worlds (223 thousand players)
- Splinterlands (127 thousand players)
- Planet IX (62 thousand players)
- Nine Chronicles (22 thousand players)
- Upland (21 thousand players)
Blockchain Gamer Statistics
Here are key blockchain statistics that answer who is playing blockchain games and what are the demographics of blockchain gaming.
Data source: Newzoo & Crypto.com research.
Respondents: 4,569 (across three major blockchain gaming markets – the United States, United Kingdom, and Indonesia).
- 13% of respondents have played blockchain games in the past and 5% are currently playing. 40% have an interest in playing. 22% of respondents have no interest in playing blockchain games. Others were confused about the prospect of blockchain gaming or never heard of it.
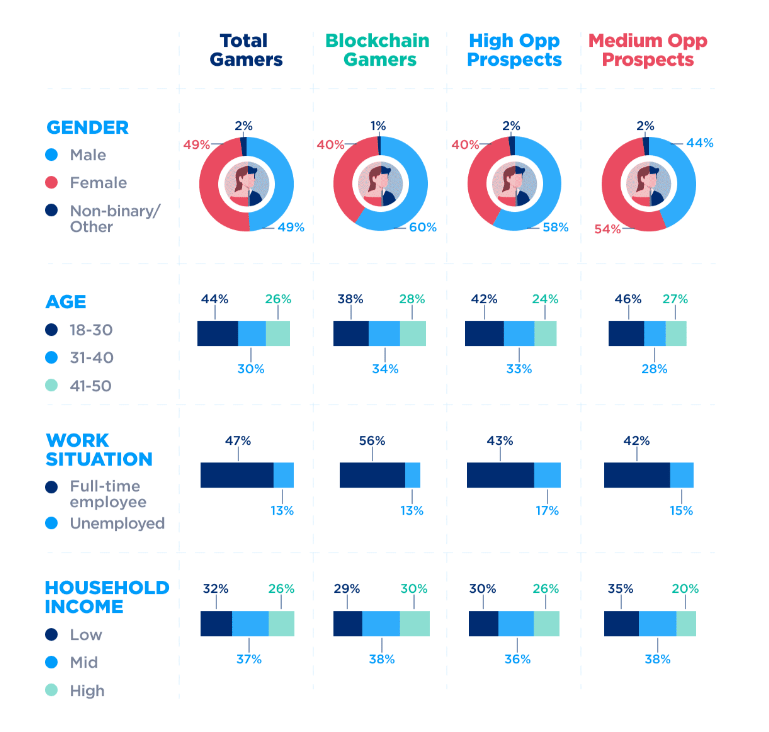
- When we look at all gamers, the gender distribution is very equal. However, blockchain gamers lean towards men (60% are men and 40% are women).
- The majority of blockchain gamers are Millennials and Gen Z.
- The majority of blockchain gamers have mid-to-high-income levels.
- Blockchain gamers are the most likely to play the following game genres: adventure, fighting, shooter, battle royale, and arcade.
- The main reasons why blockchain gamers spend money on games are unlocking extra content, leveling up a character, personalizing a character, gaining an advantage, special offers, investing, and speeding up progress.
- The main reasons why blockchain gamers don’t spend on games are overly expensive content, the game is fun without extra content, items can be acquired by grinding, investment is required too early, not sure how long they’ll play, no bundle offers, and a lack of customization options.
- Here’s why blockchain gamers play blockchain games: to earn a bit extra on the side (34%), grow crypto assets (30%), build an NFT collection (24%), because it’s fun (23%), to explore virtual worlds (20%), make a living out of a hobby (17%), collect items (15%), customize avatars (15%), and socialize (13%).
- Prospects require the following things from blockchain games to start playing: less cost of entry, more knowledge, more accessibility for non-techies, more exciting games, sustainable in-game economies, stable crypto market, and reducing negative climate impact.
- Game features that appeal to blockchain gamers are appealing gameplay, appealing graphics, innovation, immersive story or lore, and a good soundtrack.
- 77% of blockchain gamers have traded items in NFT marketplaces in the past.
- Blockchain gamers prefer in-game markets for trading game items because they find it more reliable.

Metaverse Statistics 2025
Here are key metaverse facts you need to know to keep up with this exciting new market!
How Many People Use the Metaverse?
- There are 400 million metaverse active users in 2025. (DappRadar)
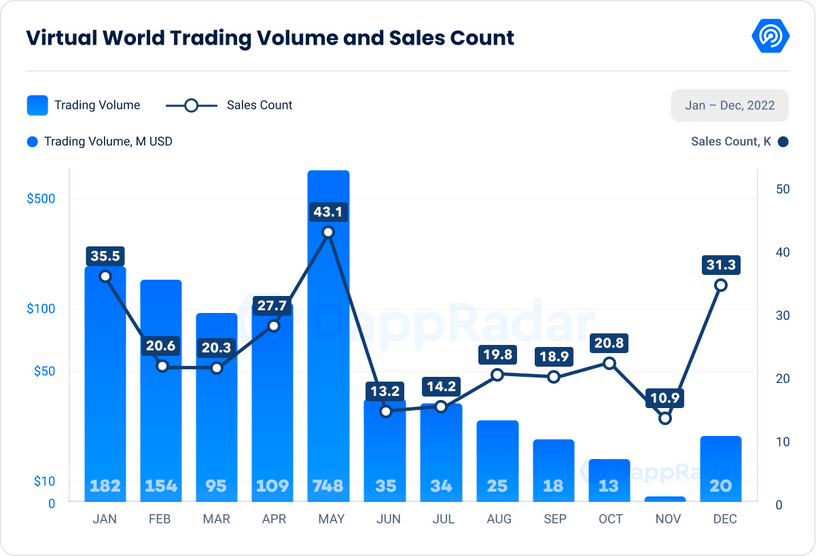
Metaverse Trading Volume
Data source: DappRadar
- In 2022, the metaverse category reached its peak trading volume in May with a total of $748 million in trading volume. The growth was triggered by the launch of 99,900 land parcels by Otherside, which generated $722 million in trading volume during the first month alone.
- However, starting in June, there was a steady decline, and by November, the trading volume had plummeted to just $9 million, with sales also decreasing.
- Despite this, the year ended on a positive note, with the trading volume increasing by 128% from November to $20 million, and sales increased by 187% to reach 31,328.

Top Metaverses by Trading Volume
Data source: DappRadar
- Otherdeed for Otherside
- The Sandbox
- NFT Worlds V2
- Decentraland
- Metroverse
- Arcade Land
- WebbLand
- FLUF World
- Metroverse Blackout
- Netvrk Land

Interest in the Metaverse
Data source: Newzoo’s Report – The Metaverse, Blockchain Gaming, and NFTs
- 25% of gamers say they occasionally get together with other players in game worlds, but do not necessarily play the main game. 13% of gamers do this often. Furthermore, it’s nearly twice as common for people younger than 18 to do this compared to people older than 25.
- 70% of questioned consumers (aged 14 to 50) say socializing in game worlds would make them play games more. This suggests the metaverse can be a catalyst to encourage even more consumers to play or return to playing games.
- Activities consumers aged 14 to 50 want to do the most in the metaverse are getting together with friends and family, watching TV, hosting events, attending concerts, attending parties, watching live sports, attending fashion shows, watching a lecture, and attending a flash mob.
- Consumers aged 14 to 50 say the features they want to see in the metaverse are the ability to customize their avatar, get free content, create content, switch game worlds, take items from one game to another, buy house decorations, buy outfits, watch movies, and buy real-life products.
Blockchain Statistics: Final Thoughts
To sum up, the latest statistics reveal that the blockchain industry, NFT market, and the metaverse industry are witnessing growth and more widespread acceptance in 2025.
As more people join these industries and new technologies and applications are developed, we can expect to see this growth continue in the years ahead.
The future looks bright, and these industries will have a significant impact on how we interact with each other and with the digital world.
Looking forward, we can’t wait to see what innovations emerge and how they’ll shape the landscape of blockchain gaming, NFTs, and digital worlds. The possibilities are endless, and it’s an exciting time to be a part of these industries.


