

![200+ Mobile Gaming Market Statistics [2026 Report]](/static/55a0a70c307f3df9e1b55209c5f76181/80bdb/mobile-games-statistics5.webp)
If you’re a mobile game developer, publisher, marketer, or investor, you need to keep up with mobile game market trends and understand where the mobile gaming industry is heading. It’s the only way to make informed decisions. To help you out, I’ve put together more than 200 mobile gaming market statistics for 2026 and beyond.
You’ll get valuable insight into the current state of the mobile gaming industry and its future.
The article includes:
- mobile game revenue statistics
- mobile gamer statistics
- monetization statistics
- mobile game marketing statistics
- ad spend
- top mobile games and publishers
- the most important mobile game KPIs
- and much more!
Use these mobile gaming statistics to get ahead of the competition and win.
Mobile Gaming Market Overview
Let’s start with a mobile game market overview including size, share, and mobile gaming revenue statistics.
What’s the Current State of the Mobile Gaming Market?
In 2022 and 2023, we’ve seen the mobile game market correction following the two years of growth that happened as a result of the lockdown. The global recession, IDFA changes, and a tumultuous period in the Chinese gaming market also had an impact on the global gaming market’s decline and industry layoffs.
However, the decline following the lockdown was expected, and the gaming market has stabilized in 2024, which is why we’re optimistic about its future. It’s important to remember that, mobile continues to be the most successful and profitable gaming sector in 2026.
Explore more mobile gaming statistics below!
Global Gaming Market Size and Growth
The global gaming industry, including mobile and other platforms, generated more than $187.7 billion in revenue in 2024, growing +2.1% YoY. (Newzoo)
Global games revenue is projected to grow to $205 billion by 2026.
Global Game Market Size by Country and Region
The Asia Pacific game market is the biggest one – it reached $88.1 billion in game revenue with a -0.8% YoY decline.
In North America, the gaming market went up +1.7% YoY to $50.6 billion, and in Europe, it increased by +0.8% YoY to $33.6 billion. (Newzoo)
Mobile Gaming Market Share
Let’s answer an important question – how much revenue is attributed to mobile games?
Out of $187 billion generated in 2024 by all types of games, the mobile game market share is 49% or $92 billion. (Newzoo)
In other words, almost half of all gaming is mobile.
Console games had a 28% revenue share, generating $51 billion. PC games had a 23% revenue share, generating $43 billion. (Newzoo)
Nothing has changed from previous years – mobile games still have the biggest market share.
Mobile Game Revenue Statistics
So, how big is the mobile games market?
Mobile game revenue in 2024 was $92 billion – up +3.0% YoY. (Newzoo)
This data shows the mobile gaming market has stabilized after the slight downturn in 2023 and is now back to where it was in 2022.
Emerging markets fueled much of this growth—Turkey led with a 28% increase in consumer spending, followed by Mexico (21%), India (17%), and Thailand (16%). Meanwhile, Saudi Arabia saw a 14% rise. (SensorTower, 2025)
Established markets like the US and EMEAR regions remained stable, while North Asia faced headwinds, with Japan experiencing a 7% decline due to economic and currency-related issues.
Mobile Game Market Growth
The mobile game market is expected to continue to grow.
Statista predicts that the mobile games market size will grow to $103 billion by 2027.
These predictions tell us the mobile gaming market is still very lucrative and offers many opportunities for game developers.
How Profitable Are Mobile Games?
Mobile games are highly profitable because they have the highest market share out of all games and boast almost $100 billion in mobile game revenue.
However, to reach high mobile game revenues, developers must be smart about their monetization strategies. Currently, in-app purchases, in-app ads, and subscriptions are the most popular monetization models, as well as a hybrid strategy.

Mobile Game Downloads Growth
In 2024, mobile game downloads reached 49.6 billion. (SensorTower, 2025)
While mobile game revenue went up, 2024 marked a slight decline in mobile game downloads –6% YoY. In fact, mobile game downloads have been declining since 2021. (SensorTower, 2025)
This decline reflects market stabilization amid industry consolidation and broader tech sector challenges.
While downloads declined in most markets, Indonesia and Saudi Arabia bucked the trend with growth.
Which Genres Drove 2024 Game Downloads?
In 2024, Simulation and Puzzle were the most downloaded mobile game genres, each capturing 20% of total downloads. Simulation saw slight growth (+0.4%), while Puzzle experienced a modest decline (-3%).
Arcade games, despite a 12.5% drop, remained popular, holding 19% of total downloads. Lifestyle and Action genres faced sharper declines, whereas Strategy games saw a 14.5% increase in downloads.
Notably, Strategy games generated 21.4% of total revenue, despite making up only 4% of downloads. (SensorTower, 2025)
These trends highlight a market where top genres continue to dominate, but niche categories are emerging as key revenue drivers.
What Are the Biggest Mobile Games Market Trends?
- Bringing mobile games to PC and console – developers are expanding their audiences beyond mobile users.
- Adapting to privacy changes – the mobile game market is adapting to a new policy and regulation landscape.
- Innovative marketing – strong content and improved user acquisition strategies are helping developers get more users in a new privacy age.
- Hybrid monetization – developers are combining several monetization methods, not relying solely on ads.
- Hybrid casual games – a genre that’s replacing classic hyper-casual games and is famous for good engagement and retention.

What Is the Leading Mobile Game Market?
According to SensorTower, the top five mobile game markets by IAP revenue in 2024 were:
- United States ($52 billion)
- China Mainland ($25 billion)
- Japan ($16 billion)
- South Korea ($6 billion)
- Germany ($5 billion)
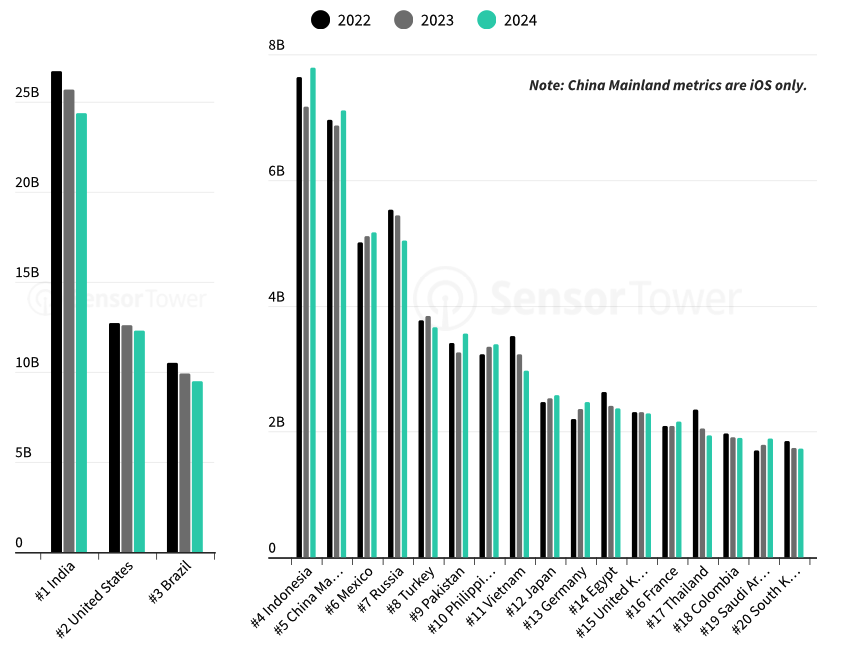
The top three mobile game markets by downloads in 2024 were India, United States, Brazil, Indonesia, and China. (SensorTower, 2025)
In 2024, global in-app purchase (IAP) and subscription revenue grew 13% year-over-year, reaching $150 billion. North America and Europe saw the strongest gains, with the United States leading at $52 billion in consumer spending. In contrast, gaming-heavy markets in Asia experienced slower growth or slight declines as non-gaming revenue outpaced game-related spending.
The surge in mobile revenue is driven by increased time spent on mobile devices and greater consumer comfort with in-app purchases. While engagement grew in most regions, it has started to level off in markets like the US and Japan.
Despite a fourth consecutive year of declining downloads, half of the top 10 markets still saw revenue growth, including Indonesia, China Mainland, and Mexico.
What Are the Most Popular Mobile Game Genres?
Simulation is the most popular mobile game genre in terms of downloads, while RPG and strategy games are the most popular mobile game genres in terms of revenue. In other words, RPG and strategy are the most profitable genres. (SensorTower, 2025)
Here are more detailed mobile gaming market statistics about popular mobile game genres.
Data source: SensorTower and data.ai – mobile intelligence providers.

Mobile Game Revenue by Genre
According to SensorTower, these are the top mobile game genres worldwide by IAP revenue. These mobile game revenue statistics by genre reveal the most profitable genres in mobile games.
- Strategy($17.5 billion)
- RPG($16.8 billion)
- Puzzle($12.2 billion)
- Casino ($11.7 billion)
- Simulation ($6.1 billion)
- Shooter ($4.3 billion)
- Action ($3.6 billion)
- Sports ($2.7 billion)
Interestingly two mid-core genres are leading in terms of mobile game revenue (RPG and strategy games). However, the casual genre (puzzle) is also high up – it’s third by mobile game revenue.
Top Mobile Game Subgenres by IAP Revenue
- Strategy | 4X Strategy
- Puzzle | Match Swap
- RPG | Squad RPG
- RPG | MMORPG
- Strategy | MOBA
- Casino | Slots
- Casino | Coin Looters
- Shooter | Battle Royale
- Simulation | Tycoon / Crafting
- RPG | Puzzle RPG
- RPG | Turn-based RPG
- Simulation | Sandbox
- Sports | Realistic Sports
- Shooter | FPS / 3PS
- RPG | Idle RPG

Top Mobile Game Genres by Downloads
According to SensorTower’s 2025 report, these are the leading mobile game genres by downloads in the US.
- Simulation (9.8 billion downloads)
- Puzzle (9.7 billion downloads)
- Arcade (9.6 billion downloads)
- Lifestyle (4 billion downloads)
- Tabletop (2.6 billion downloads)
- Action (2.4 billion downloads)
- Shooter (2.4 billion downloads)
- Strategy (2.1 billion downloads)
Top Mobile Game Subgenres by Downloads
- Arcade | Platformer / Runner
- Simulation | Simulator
- Simulation | Driving / Flight Simulator
- Lifestyle | Customization
- Puzzle | Riddle
- Arcade | Other Arcade
- Racing | Arcade Racing
- Simulation | Sandbox
- Sports | Realistic Sports
- Action | Action Sandbox
- Lifestyle | Virtual Pet
- Shooter | FPS / 3PS
- Tabletop | Board
- Simulation | Idler
- Arcade | Arcade Driving
Arcade platformer and runner games were the most downloaded mobile games in 2024, making up 8.34% of total downloads, largely due to the lasting success of Subway Surfers. Simulation games came next, with the Simulator subgenre at 6.17% and Driving/Flight Simulator at 4.98%, showing strong player interest in realistic, task-focused gameplay seen in titles like My Supermarket Simulator 3D and Vehicle Masters.
Most Saturated Mobile Game Genres
- Party
- Shooting
- Sports
- Match
- Tabletop
- Strategy
- Racing
- Puzzle
- RPG
- Action
What are the Most Popular Mobile Games and Publishers?
We’re moving from top genres and subgenres to the most popular mobile games and publishers.
Our data source for these lists is AppMagic, a leading mobile intelligence provider. Get 3 days of free access to all AppMagic’s features, as well as 10% off, by clicking on this link.

What Are the Most Downloaded Mobile Games?
Wondering what is the number 1 mobile game in the world? Check out this list of the most downloaded mobile games of 2024.
- Roblox (221 million downloads)
- Block Blast (217 million downloads)
- Subway Surfers(176 million downloads)
- Ludo King (171 million downloads)
- Pizza Ready! (171 million downloads)
- Free Fire (148 million downloads)
- Offline Games (143 million downloads)
- Free Fire MAX (139 million downloads)
- 8 Ball Pool (129 million downloads)
- My Talking Tom 2 (115 million downloads)
Most Downloaded Mobile Games of All Time
The most downloaded mobile games of all time are:
- Subway Surfers
- Candy Crush Saga
- Free Fire
- My Talking Tom
- Temple Run 2
- Hill Climb Racing
- Clash of Clans
- 8 Ball Pool
- My Talking Angela
- Temple Run

Top-Grossing Mobile Games
This is a list of top-grossing mobile games (by yearly IAP revenue in 2024 reduced by platform fees and taxes).
- Monopoly GO($2.2 billion)
- Honor of Kings ($1.8 billion)
- Royal Match($1.4 billion)
- Roblox ($1.19 billion)
- PUBG Mobile ($1.18 billion)
- Last War: Survival ($1.14 billion)
- Candy Crush Saga ($1 billion)
- Whiteout Survival ($998 million)
- Dungeon & Fighter ($796 million)
- Coin Master ($729 million)
Also, check out our list of best-selling games of all time!
Top Mobile Game Publishers by Downloads
These are the top mobile game publishers by downloads.
- Azur Games (1.4 billion downloads)
- Supersonic Studios (979 million downloads)
- SayGames (939 million downloads)
- BabyBus (879 million downloads)
- Miniclip (727 million downloads)
- VOODOO (709 million downloads)
- Outfit7 (699 million downloads)
- iKame Games – Zego Studio (694 million downloads)
- Supercent (495 million downloads)
- Homa (485 million downloads)
Top Mobile Game Publishers by Revenue
This is a list of the top mobile game developers and publishers by revenue.
- Tencent ($6.2 billion)
- Scopely ($2.6 billion)
- Playrix ($1.6 billion)
- NetEase ($1.6 billion)
- Dream Games ($1.4 billion)
- King ($1.4 billion)
- Supercell (1.4 billion)
- Cognosphere ($1.3 billion)
- Roblox ($1.1 billion)
- FunFly ($1.1 billion)
Most Played Mobile Games
These are the most played mobile games by monthly player count:
- Roblox
- Candy Crush Saga
- Free Fire
- PUBG Mobile
- Royal Match
- Honkai: Star Rail
- Brawl Stars
- Honor of Kings
- Township
- Fishdom
- Coin Master
- League of Legends
How Many Mobile Games Are There?
There are more than 700 thousand mobile games on Google Play and Apple’s App Store. New mobile games are published every day, which makes the mobile gaming market very competitive.

Mobile Game Monetization Statistics
We’ve already answered how much money do mobile games make. But the question is how mobile games make money.
The following mobile game monetization statistics shed some light on various methods like in-app purchases and in-app ads.
- 74% of mobile gamers in the United States would watch a video advertisement if they got in-app content in return. (eMarketer)
- 82% of mobile gamers say they are more into free mobile games that include ads than paid games with no ads. (eMarketer)
- In-app purchases account for 95% of all user spend. (TechCrunch)
Players of hyper-casual games watch two times more ads than players of other mobile game genres. (VentureBeat)
- Women are much more likely to make an in-app purchase than men. (Venturebeat)
- More than 30% of female players will pay for a mobile game. (MediaKix)
- User impressions per DAU are doubling every year. (data.ai)
- In-app bidding is now the dominant form of managing ad monetization. It replaced traditional waterfalls. (data.ai)
- Mobile game influencers affect users’ purchasing decisions by 21% more than non-gamer influencers. (Newzoo)

What Is the Average Mobile Gaming Revenue Per User (ARPU)?
The average revenue per user (ARPU) for mobile games in the US is $60.58 in 2025. It is predicted to reach $65 by 2029. (Statista, 2025)
Global eCPM by Country
In this section, we bring you the eCPM report by country for rewarded, interstitial and banner ads on both Android and iOS.

Rewarded Video Ads (Android & iOS)
- The United States is the country with the highest eCPMs for rewarded ads – $12.91 on Android and $13.18 on iOS.
- eCPMs were slightly higher for iOS than Android rewarded ads. For the top 20 countries, eCPMs on Android range from $3.31 to $12.91, while on iOS, they range from $4.73 to $13.81.

Interstitial Ads (Android & iOS)
- Five countries with the highest eCPMs for interstitial ads on both Android and iOS were the United States ($11.06 Android, $9.58 iOS), Canada ($8.64 Android, $7.21 iOS), Australia ($6.65 Android, $6.88 iOS), Denmark ($6.34 Android, $5.76 iOS), and Switzerland ($6.27 Android, $5.73 iOS).

Banner Ads (Android & iOS)
- The United States is the country with the highest eCPMs for banner ads on both Android ($0.60) and iOS ($0.27).
- Across all countries, eCPMs for banner ads are higher on Android than on iOS.
Get more detailed eCPM statistics here.

Mobile Gamer Statistics for 2025
Here are some interesting mobile gamer statistics including size, demographics, interests, behavior, and player personas.
How Gamers Are There in the World?
There are 3.2 billion active mobile gamers worldwide.
The number of gamers will grow to 3.5 billion by the end of 2025. (Newzoo)
Some mobile gamers are more active than others. For example, mobile gamers in Indonesia, Brazil, Saudi Arabia, Singapore, and South Korea play mobile games the most – they surpassed 5 hours per day playing mobile games in 2024. (data.ai)
Mobile Gaming Demographics
People of all ages play mobile games.
29.5% of mobile gamers are 25-34 years old and 28.3% are 16-24 years old.
Slightly older generations are also into games – 23.1% of the mobile gaming audience are 35-44 years old, 12.8% are 45-54 years old, and 6.3% are 55 and older. (Zorka Agency)

Percentage of Gamers by Platform
77% of Gen Z players, 73% of Millennials players, 54% of Gen X players, and 34% of Baby Boomer players play on mobile. (Newzoo)
What’s the Average Age of a Mobile Gamer?
The average age of a mobile gamer is 36. (MoPub)
This shows us that not only the youngest generation plays mobile games. In fact, people older than 35 make up almost half of the mobile gamer audience. (Mediakix)
What Gender Plays More Mobile Games?
Mobile games are almost equally popular with men and women.
53.6% of the overall mobile game audience are men and 46.4% are women. (Zorka Agency)

Mobile Gamer Statistics: Interests and Behavior
-
- Gen Z and Millennials spend more time gaming than on any other form of entertainment. (Newzoo)
- 85% of mobile gamers do not identify as gamers. (Mediakix)
- On average, mobile gaming sessions last 25% longer for women than for men. (MoPub)
- 43% of female gamers play more than five times a week. (MoPub)
- 38% of male gamers play more than five times a week. (MoPub)
- Users spend 90% of their smartphone usage on apps and games. (eMarketer)
- On average, gamers play two to five mobile games a month. (data.ai)
- Users spend three and a half hours using mobile devices every day, and 11% of that time is spent on mobile gaming. (eMarketer)
- On average, hyper-casual mobile gamers download ten times more games than other players. (VentureBeat)
- More than 50% of gamers play mobile games while in the bathroom. (Mediakix)

Favorite Mobile Game Genres and Franchises by Generation
Here are more interesting statistics about generations and gaming.
- According to Newzoo’s research, Gen Z players prefer battle royale, sandbox, and MOBA games. Fortnite, Roblox, Minecraft, and Among Us were their favorite franchises.
- Millennials enjoy RPG, strategy, and adventure games, like Hearthstone, the most.
- Gen Z players are mainly into puzzle, shooter, and sports games.
- Baby Boomers are also into puzzles, as well as tabletop games and match games like Candy Crush Saga.

Share of Players’ Personas per Generations
- According to Newzoo, 23% of Gen Z players and 20% of Millennials fall into the group of so-called Bargain Buyers. This type of player enjoys high-quality free-to-play games.
- 38% of Gen X gamers and 66% of Baby Boomers identify with The Time Filler persona. These players play mobile games when they have some time to spare.
Why People Play Mobile Games?
Here are the main reasons why people play mobile games:
- To relieve stress;
- Pass the time;
- To immerse themselves in another character or world;
- To feel accomplished for completing something challenging;
- Express something unique about themselves;
- To connect with people they already know;
- Be dazzled by something unique;
- To connect with a subject they’re passionate about outside gaming.
(Data source: Facebook Gaming)
What Influences Players to Return After 30 Days?
- Someone bringing up the game during an in-person conversation
- Hearing about new content or available updates
- Hearing about a reward for coming back
- Seeing the game mentioned on social media by friends/family
- Seeing news articles or blog posts about the game
(Data source: Facebook Gaming)

BONUS: How Youngest Generations Engage with Games
Wondering how the youngest generations interact with games? Here are the highlights from recent Newzoo research on Gen Z and Gen Alpha gamers.
- Gen Z spends 17% of their free time playing games, while Gen Alpha spends the majority of their free time on games – 21%, making games the number one source of entertainment for this generation.
- 90% of Gen Z and 94% of Gen Alpha gamers fall into the category of game enthusiasts, i.e., consumers who engage with gaming through playing, viewing, owning, and/or social behavior.
What’s the Most Popular Gaming Platform for Younger Players?
- Mobile is by far the most popular platform for Gen Alpha and Gen Z gamers. 73% and 69% of them play games on their mobile phones.
- On average, Gen Z gamers play for 6 hours and 10 minutes. Gen Alpha gamers spend even more time playing – 6 hours and 49 minutes.

Do Younger Generations Spend on Mobile Games?
- Younger generations are more likely to spend on mobile games. 52% of Gen Alpha and 52% of Gen Z gamers are payers, while only 42% of the total gamer population are payers.
- Newzoo’s research discovered that the number one reason for making an in-app purchase for both Gen Alpha and Gen Z is unlocking exclusive content. It’s followed by personalizing characters or items.
- 93% of Gen Alpha and 91% of Gen Z have spent money on in-game purchases during the past 6 months.
- Gen Alpha players spend the most on gear, playable characters, and in-game currencies. Gen Z players spend the most on in-game currencies, gear, and playable characters.
For more data, check out our article on Gen Alpha and Gen Z gamers.
Global Mobile Ad Spend
Each year, mobile is taking over advertising share more and more.
Data source: data.ai
Ad spending in the global in-app advertising market is projected to reach $390 billion by the end of 2025. (Statista)
Mobile Game Marketing Statistics
The following mobile gaming market statistics are about marketing and advertising. They include highlights from the most recent SocialPeta research.

The Number of Game Advertisers and Ad Creatives
The mobile gaming industry experienced a surge in advertising throughout 2024, with the number of advertisers surpassing 259,700, reflecting a 60.4% year-over-year increase. According to SocialPeta, this rapid growth is expected to continue, with projections indicating the total will exceed 300,000 by 2025.
Alongside the rise in advertisers, creative production also expanded, though at a slower pace. In 2024, the number of creative assets for mobile games reached 46.2 million, marking a 15.4% increase compared to the previous year.
However, this growth was significantly lower than the 29.8% increase recorded in 2023, suggesting a shift in marketing strategies. Despite this slowdown, industry projections estimate that by 2028, creative assets will surpass 10 million globally, reinforcing the competitive landscape of mobile game marketing.

The Number of Game Advertisers and Ad Creatives by Genre
Genres with the largest percentage of ad creatives are casual (30.6%), puzzle (12.2%), RPG (12%), simulation (7.5%), casino (6.8%), action (6.1%), card (4%), adventure (3.3%), and board (2.7%).
Genres with the largest percentage of advertisers are casual (27.2%), casino (21%), puzzle (12.6%), simulation (7.3%), action (5.7%), RPG (5.2%), SLG (3.9%), adventure (3.2%), card (2.5%), and board (2.2%).
Additional Analysis of Mobile Game Ad Creatives
- Hong Kong, Macau, and Taiwan led global mobile game marketing efforts, with the most intense advertising campaigns.
- The USA had more monthly mobile game advertisers than all of Europe combined, highlighting its dominance in the industry.
- The share of iOS advertisers continued to shrink, falling below 26% in 2024, but 70% of iOS advertisers launched new creatives monthly, nearly 20% higher than Android.
- Android accounted for 72.3% of total creative assets, with casual games contributing over 83% of all Android creatives.
- Monthly new creatives made up about 49% of total creatives on both iOS and Android, indicating a balanced approach to fresh content across platforms.
- Video creatives saw a 6.9% decline compared to the previous year, while image creatives had a 5.2% higher share among monthly new creatives.
Top Mobile Games by Advertising
In the images below, you can see the top 50 games by advertising on both Android and iOS.
Data source: SocialPeta
Top Games by Advertising on Android

Top Games by Advertising on iOS

Mobile Gaming Market Statistics: KPIs by Genre
In this section, we’ll focus on mobile gaming market statistics based on the most important metrics across different gaming genres. The statistics include the following metrics: user retention, playtime, average session length, session count, and installs ratio.
Data source: GameAnalytics
The data is for the top 25%, median 50%, and bottom 25% of games in the casual, classic, and mid-core genres. Here’s how GameAnalytics categorized them.
Casual genre: action, adventure, arcade, casual, and puzzle games.
Classic genre: board, card, casino, trivia, and word games.
Mid-core genre: multiplayer, role-playing, simulation, strategy, racing, and sports games.

Mobile Games Statistics: User Retention
Let’s start with the average user retention statistics.
Casual Games
- Average day 1 user retention for the top 25% of games in the casual genre is 28%. For median games, it’s 20%, and for the bottom 25%, it’s 12%.
- After day 7, the top 25% of games in the casual genre retain an average of 6.7% of users. Median casual games retain 3.5%, and the bottom 25% retain around 1.4% on average.
- Average day 28 retention for the top 25%, median 50%, and the bottom 25% of games in the casual genre is 2.1%, 0.7%, and 0.02%, respectively.
Classic Games
- Average day 1 user retention for the top 25% of games in the classic genre is 31%. For median games, it’s 22%, and for the bottom 25%, it is 12%.
- After day 7, the top 25% of games in the classic genre retain 11% of users on average. The median 50% of casual games retain 6%, and the bottom 25% retain just 2%.
- Average day 28 retention for the top 25%, median 50%, and the bottom 25% of games in the classic genre is 5.5%, 2%, and 0.2%.
Mid-Core Games
- Day 1 retention for the top 25% of mid-core games is around 26%. For the median 50% of games, it’s 18%, and for the bottom 25%, it’s 11%.
- After one week, the top 25% of games in the mid-core genre retain 5.4% of users on average. The median 50% of games in this category retain 2.7%, and the bottom 25% retain 1.2%.
- Average day 28 retention for the top 25%, median 50%, and the bottom 25% games is 1.6%, 0.6%, and 0.03%, respectively.
Mobile Games Statistics: Average Playtime
Another important game metric is playtime.
Playtime is the total time a user spends playing a game (combining all sessions) per day. Here’s how much users play casual, classic, and mid-core games.
Casual Games
- Top 25% of games – 28 minutes
- Median 50% of games – 15 minutes
- Bottom 25% of games – 9 minutes
Classic Games
- Top 25% of games – 48 minutes
- Median 50% of games – 31 minutes
- Bottom 25% of games – 18 minutes
Mid-Core Games
- Top 25% of games – 34 minutes
- Median 50% of games – 17 minutes
- Bottom 25% of games – 10 minutes
Mobile Gaming Statistics: Average Session Length
Below is the average session length for games in the casual, classic, and mid-core genres.
Average session length looks at how long users play a game, from starting to finishing a session.
Casual Games
- Top 25% of games – 7 minutes
- Median 50% of games – 4 minutes
- Bottom 25% of games – 3 minutes
Classic Games
- Top 25% of games – 10 minutes
- Median 50% of games – 6 minutes
- Bottom 25% of games – 4 minutes
Mid-Core Games
- Top 25% of games – 8 minutes
- Median 50% of games – 5 minutes
- Bottom 25% of games – 3 minutes
Mobile Gaming Statistics: Session Count
Let’s move on to sessions.
Session count is the average number of sessions played per user on a given day.
Here are the averages:
Casual Games
- Top 25% of games – 5 average sessions per day
- Median 50% of games – 3 average sessions per day
- Bottom 25% of games – 2 average sessions per day
Classic Games
- Top 25% of games – 6 average sessions per day
- Median 50% of games – 4 average sessions per day
- Bottom 25% games – 3 average sessions per day
Mid-Core Games
- Top 25% of games – 4 average sessions per day
- Median 50% of games – 3 average sessions per day
- Bottom 25% of games – 2 average sessions per day
Mobile Gaming Statistics: Installs Ratio
Moving on to installs.
The installs ratio is the percentage of daily active users who launched the game for the first time.
Here are the averages:
Casual Games
- Top 25% of games – 52%
- Median 50% of games – 33%
- Bottom 25% of games – 17%
Classic Games
- Top 25% of games – 33%
- Median 50% of games – 15%
- Bottom 25% of games – 6%
Mid-Core Games
- Top 25% of games – 57%
- Median 50% of games – 39%
- Bottom 25% of games – 21%
Mobile Gaming Market Statistics for 2025: A Summary
These mobile gaming statistics show that the mobile gaming market experienced a slight decline in 2022 and 2023 following the boom in 2020 and 2021.
However, this market correction was expected and the market stabilized in 2024. My prediction is that it will continue to grow in 2025 and the years to come.
How to keep up?
Game developers and marketers need to readjust their strategies to focus on improving user experiences and making their games as engaging as possible – it’s the key to successful monetization.
Furthermore, user acquisition strategies are constantly evolving and now is more important than ever to target the right audience with the right creatives. If you need any help with acquiring users, make sure to contact us – it’s what we do best!
In any case, it will be exciting to see how the mobile gaming market will change and evolve in the future – I’ll keep you posted. I update these mobile gaming statistics regularly so make sure to check in.
Which mobile gaming statistics did you find the most surprising? Let me know in the comments below!
Data Sources
- SensorTower, 2025. State of Mobile 2025 Report
- Epyllion, 2025. The State of Video Gaming 2025
- Newzoo, 2025. Global Games Market Report
- Statista, 2025. Mobile Gaming in 2025 and Beyond
- AppMagic, 2025. Casual Games Report
- AppMagic, 2025. Top Mobile Games and Publishers
- SocialPeta, 2025. Global Mobile Games Marketing Trends
- GameAnalytics, 2025. Benchmarks, 2025
- eMarketer, 2025. Digital Gamers 2025
- eMarketer, 2025. Mobile Gaming 2025
- Venturebeat, 2025. Mobile Gaming Revenue is Up, 2025
- Facebook, 2024. Facebook Gaming Report
- Newzoo, research on Gen Z and Gen Alpha gamers
- MoPub, 2025
- Mediakix, 2025
- Zorka Agency, 2025
- TechCrunch, 2025


