


How do you know if your mobile game is performing well? The short answer is—by tracking various mobile game KPIs.
You’re probably wondering, which key performance indicators should you track?
To make your life easier, I’ve put together an extensive list of all essential mobile game KPIs and metrics for all parts of the journey.
What Are Mobile Game KPIs?
Mobile game KPIs or key performance indicators are quantifiable metrics that help you evaluate your game’s performance.
Besides general mobile game KPIs, there are various engagement, monetization, user acquisition, and app store optimization metrics you should keep an eye on.
Mobile game key performance indicators are usually categorized based on specific parts of the user journey you’re assessing.
Why You Need to Track Mobile Game KPIs?
As I mentioned, mobile game KPIs help you see how successful and profitable your game is. However, these metrics also aid you in tracking progress towards certain goals as well as identifying what can be improved along the way.
For example, by monitoring marketing KPIs, you get valuable info on your UA campaigns, which you can then use to improve them. The same goes for monetization and all other aspects of the user journey. Put simply, key performance indicators help you identify what’s working and what’s not.
General Mobile Game KPIs
Let’s start with general mobile game KPIs you need to track if you’re a mobile game developer or publisher.
Downloads
This one is quite obvious – if you have a mobile game, you’ll want to track how many times it has been downloaded. It is the foundation for many other mobile gaming KPIs. It’s also the first indicator of how popular and successful your game is.
To increase the number of downloads, you need to come up with a stellar mobile game marketing strategy.
Installs
You might think tracking downloads and installs are the same things.
They’re not. Here’s why.
When someone downloads a mobile game, that doesn’t necessarily mean that the installation and setup process was completed. For that reason, you also need to track the number of mobile game installs on users’ devices.
It’s also useful to monitor how many people uninstall your mobile game and try to figure out why.
However, keep in mind that different ad networks tend to have different definitions of what constitutes a download or an install, so make sure to check it to avoid confusion.

Subscriptions
If your mobile game offers subscriptions for additional content or features, you should note the number of people who sign up, as well as those who unsubscribe.
Furthermore, it’s useful to know how long it takes for users to subscribe and what convinces them to do so.
Registrations
Having users register instead of playing as a guest is always a plus, as it gives game publishers access to their email addresses and other beneficial data.
Moreover, when a user registers, that’s a sign that they’re into the game and plan on engaging with it.
User Growth Rate
This gaming KPI tells you the growth rate of your userbase. It’s useful to know not only how fast or slow it’s growing, but also what triggers its growth.
For example, you might notice a spike after using new ad creatives in advertising or after an update. Whatever it may be, it’s important to attribute the growth to a specific event.
Engagement Mobile Game KPIs
The first goal for any mobile game developer is to get people to install their game. However, that’s only the beginning. After installation, one of the main objectives is to keep users engaged with the game, as that opens the door for monetization.
Here are the essential mobile game KPIs related to engagement that will tell you how absorbed people are with your game.

User Retention KPIs
Retention rate is one of the most significant engagement KPIs. It tells you how many players return to your game after a specified time period has passed. Most commonly, user retention is measured after days 1, 7, 28, 60, and 90. However, you can measure it for any time period.
For example, day-1 user retention looks at how many players return after one day of playing a game.
If a mobile game successfully retains users for longer periods, that means it’s flourishing and has a high earning potential.
According to GameAnalytics, if a game has day-1 user retention of 30% or more, that’s considered excellent. Anything less than 20% is not that good.
For example, in 2021, the average day-1 user retention for the top 25% of mobile games was 30%. (GameAnalytics)
A game with poor day-1 user retention might get deemed not good enough and get scrapped. This is something many publishers do because it doesn’t make sense to further invest in a game that doesn’t show potential for success and profitability.
User Retention Statistics
If you want to benchmark the user retention of your mobile game against others, take a look at these statistics from GameAnalytics.
This was the average user retention in 2022 for all game genres combined.
- Day-1 user retention – 28% (top 25% of games), 20% (median 50% of games), 12% (bottom 25% of games).
- Day-7 user retention – 6% (top 25% of games), 3% (median 50% of games), 1% (bottom 25% of games).
- Day-28 user retention – 2% (top 25% of games), 0.7% (median 50% of games), 0% (bottom 25% of games).

Session Count
Session count is the average number of sessions played per user on a given day, week, or month. In other words, it tells you how many times a user opens up the app.
Naturally, the higher the session count the better, as it means players are engaging with your game more often.
According to GameAnalytics, the average session count for mobile games in 2021 was 5 for the top 25% of games. For the median 50% of games, it was 3.7 sessions on average, and for the bottom 25% of games, the session count was 2.6.

Average Session Length (ASL)
Average session length, or ASL, tells you how long users play a game, from the time the session starts (a player opening the app) until it finishes (the app is closed or sent to the background). In other words, it’s the average duration of a single session.
Here’s some ASL data from GameAnalytics.
In 2022, the leading 25% of mobile games had 7 minutes average session length – the same as in 2021. ASL for the median 50% of mobile games also stayed the same in 2022 – 3 minutes.
The bottom 25% of mobile games had an average session length of around 2 and a half minutes.

Playtime
Playtime refers to the total time a user spends playing a game per day. That means all the sessions in a day are combined.
According to 2022 data from GameAnalytics, gamers were spending around 27 minutes per day playing the top 25% of mobile games. That’s 2 minutes less than in 2021.
When it comes to the median 50% of games, their average playtime was around 14 minutes throughout 2022 – the same as in 2021.
Playtime for the bottom 25% of games was around 8.5 minutes.
Session Interval
Session interval shows you how much time has passed between sessions. For example, do users play your game two times a week, every day, or multiple times a day? Naturally, you should aim for shorter session intervals.
Oftentimes, you’ll find that session intervals are tied with in-game events. For example, content updates.
Session Depth
Session depth is another useful metric that tells you how many interactions a user has with your game per session.
For example, if a user just logs in, collects a daily reward, and logs out, that would be low session depth as there wasn’t a lot of interaction.
On the other hand, if a user goes further, like completing a couple of levels or even making an in-app purchase, that’s considered to have more session depth.

Install Ratio
Install ratio is the percentage of daily active users who launched the game for the first time.
According to GameAnalytics, the average installs ratio for mobile games in 2022 was around 54% for the top 25% of games – 2% more than in 2021. It was around 31% for the median 50% of games, and 15% for the bottom 25% of games.
Daily Active Users (DAU)
Daily active users or DAU refers to the number of users who are active in a mobile game each day. In other words, the users who engage with a mobile game on a daily basis.
Naturally, the more daily active users a mobile game has, the more successful and sticky it is.
Monthly Active Users (MAU)
This is a similar metric as the previous one. Monthly active users refer to the number of users who visit a mobile game on a monthly basis.
Here’s how to increase monthly active users.

Stickiness
So DAU tells you how many daily active users you have and MAU tells you how many monthly users you have.
Stickiness is DAU to MAU ratio and it tells you how many of the monthly active users play your mobile game every day.
If you want to calculate stickiness, divide DAU with MAU and multiply with a hundred. For example, if you have 3,000 MAU and 300 DAU, the stickiness rate would be 10%.
To improve stickiness, you need to work on overall retention and engagement. Having a simple onboarding process, adding new content and features, using push notifications, and rewarding players who come back are all good strategies for improving it.

Churn Rate
Churn rate reveals the number of users who stop using or uninstall your mobile game. Naturally, you’d want the churn rate to be as low as possible.
Just like user retention, it’s usually measured on days 1, 7, and 30. However, churn rate is the exact opposite of retention rate.
According to Andrew Chen, Silicon Valley analyst, the average mobile app loses as much as 77% of its users just 3 days after the installation.
User Acquisition KPIs
Let’s move on to app marketing KPIs that will help you determine the success of your user acquisition campaigns and make better marketing decisions.

Cost Per Install (CPI)
Put simply, Cost Per Install, or CPC, is the price you pay when a user installs your mobile game after seeing an ad. It’s specific to paid UA campaigns for apps.
CPIs vary depending on the platform (iOS, Android), country/region, ad format, and the genre of the game. The United States usually has the highest CPIs.

Cost Per Completed View (CPCV)
CPCV stands for Cost Per Completed View, and as the name implies, it’s the cost you pay each time a user watches a video ad until the end. So unlike the CPI model, where you pay for an install, with CPCV, you pay for a completed view.
It is calculated by dividing advertising cost with a completed video view.

Cost Per Click (CPC)
Cost per click is another popular pricing model used in mobile UA campaigns. In this case, you pay when a user clicks on your in-app ad.

Cost Per Engagement (CPE)
In the Cost Per Engagement model, you pay only when a user completes a desired action whether it’s within the ad or the game. Because of that, it can be used in campaigns with a specified post-install event.

Cost Per Acquisition (CPA)
Cost Per Acquisition is a metric that measures how much it costs when a user completes a certain action post-install. For example, completing a level or making an in-app purchase. CPA is also known as cost per conversion. It’s similar to Cost Per Engagement.

Customer Acquisition Cost (CAC)
Put simply, CAC is the cost of acquiring a customer, including all advertising costs and the time you put into marketing a mobile game.
You can calculate it by dividing the total marketing costs with the number of new customers.
Effective Customer Acquisition Cost (eCAC)
This is the effective cost of customer acquisition that includes both organic and paid UA methods, as well as all other marketing expenses, including time spent.
Organic Conversion Rate
This metric reveals the conversion rate for organic user acquisition. This includes discovery on the app stores, organic search, influencer marketing, and social media efforts that don’t include ads or any other paid methods.
In other words, anything that doesn’t belong to paid user acquisition.
Paid Conversion Rate
Unlike organic conversion rate, paid conversion rate tells you how many conversions you get through paid advertising. That includes all types of ad campaigns on social media platforms and ad networks, promoted social media posts, paid influencer collaborations, etc.

New Users
This metric is also among the essential mobile game KPIs for user acquisition. It tells you how many new installs your game averages each day. That, in turn, suggests how popular your game is, as well as how your user acquisition campaigns are performing.
Here are some 2022 for all mobile game genres from GameAnalytics. They define new users as, “how many installs games average each day, indicating popularity and UA efforts.”
In 2022, the top 25% of games got anywhere from 1,243 to 1,560 installs each day. For the median 50% of games, that number was significantly lower – around 250. The bottom 25% of mobile games got about 75 installs each day in 2022.
Install Source
This mobile game KPI is about attribution – it tells you which channel are the installs for your mobile game coming from. Knowing this is essential because it allows you to tweak your user acquisition campaigns and improve their performance.
For example, you might discover that most of your installs come from organic search on Google Play or perhaps from app install ads on Facebook.
Geographic Location
In order to optimize your user acquisition campaigns, you also need to know the geographic location of your users, as well as their language.
This is the basis of any user acquisition campaign.
However, where your users are from also affects monetization i.e., in-app purchases and in-app ads.

Demographics
Demographics refers to data on users’ age, gender, interests, behavior, education, income level, etc. It helps you build a user profile.
Knowing your existing users and your target audience is essential not only for user acquisition campaigns but also for monetizing a mobile game.
For example, if you have a casual puzzle game, you’ll probably notice that the majority of your audience includes women over 30 and that this should be your main target audience.
Along with the basics like age and gender, you can also get into player motivations, i.e., reasons why people play mobile games. Then you can advertise your game with motivation-based creatives, which are known for their effectiveness.
Cohorts
A cohort is a group of users who share common characteristics. For example, they have the same demographics or player motivations.
Whatever it may be, grouping similar users into cohorts is helpful because it can enlighten you on both existing and potential players. That, in turn, helps you improve your user acquisition campaigns.
K Factor
K factor refers to the virality of a mobile game. This metric tells you how much your game grows by word of mouth or referral programs. In other words, the number of new users your existing users bring to your mobile game.
Thus, the more people talk about your game and refer it, the higher your K factor is.
This metric can inform your UA efforts because it shows you how paid UA campaigns influence organic growth.
There are many different ways to calculate the virality of a mobile game. To get the most accurate results, you need to do complex cohort-based analysis, which is better left to a data scientist.
According to Devtodev the simplest formula is “k-factor = i*c where i is an average number of invitations sent by one user, c is an average conversion from received invitation into registration.”

Return on Investment (ROI)
Generally speaking, return on investment, or ROI is the profit you make from an investment. In terms of marketing a mobile game, it’s the profit you make from your marketing investment.
Monetization Mobile Game KPIs
In this section, I go through mobile game KPIs related to monetization and revenues.
Average Revenue Per User (ARPU)
As the name implies, average revenue per user, or ARPU, tells you what’s the average revenue you earn per user in a certain period. The revenue includes money from in-app purchases, subscriptions, ads, etc.
A high ARPU is one of the indicators of a well-thought-out and successful monetization strategy.
Calculating it is simple – divide revenue generated by the number of users.
Average Revenue Per Daily Active User (ARPDAU)
ARPDAU is similar to ARPU. However, average revenue per daily active user focuses on users who play your game every day.
To calculate ARPDAU, use the same formula for ARPU, but use revenue and number of users for a particular day.
You can do the same for any time period. For example, if you’re measuring revenue per weekly active user, you get ARPWAU. You can also measure ARPMAU if you add monthly active users to the equation.
Tracking ARPDAU is important for many reasons. Most importantly, it shows you how much your game earns from its users. Moreover, you can identify certain revenue trends that will help you adjust your strategy.
Time to First Purchase
This mobile game key performance indicator tells you how much time has passed between a user installing your mobile game and making an in-app purchase.
The goal, of course, is to have a very short time to the first purchase. In other words, to get users to make an in-app purchase as soon as possible. However, that’s easier said than done as it usually takes some time to convince players to make their first purchase.

Lifetime Value (LTV)
This is one of the most important monetization mobile game KPIs. It tells you the total revenue a user has generated for you during their lifetime.
Lifetime value is great for determining the overall profitability and value of a mobile game, as well as getting to know your user better. Furthermore, it helps you decide how much money to spend on user acquisition.

eCPM
eCPM stands for effective cost per mile and it is the revenue a mobile game publisher earns per 1,000 ad impressions displayed on their game.
It’s one of the essential mobile game KPIs in regards to monetization as it allows you to monitor the overall performance of your in-app ad strategy. The goal, of course, is to get high eCPMs. The higher the conversion rate is, i.e., the more users ads convert, the more a mobile game developer gets paid.
On the other hand, on the user acquisition side, a high eCPM means your ad will get served first, which helps you scale. Thus, in this case, eCPMs describe the campaign’s buying power.
eCPM values also depend on the ad format, ad network, country, and platform (iOS, Android).
In terms of monetization, eCPM is calculated by dividing total earnings with total impressions and multiplying by 1,000. For example, if you earned $800/day and served 300,000 impressions, you would calculate it like this.
($800/300,000) x 1,000 = $2.6 eCPM
ASO KPIs
App store optimization is an essential part of the success of any mobile game. By doing a good job of optimizing your app store listings, you boost the visibility of your game and attract new users.
Many of these metrics I already covered earlier, as they relate to UA and engagement (installs, new users, daily active users, etc.). However, there are some specific to the app stores and the process of ASO.
These are the most important ASO KPIs you need to follow.
Page Visits
One of the most important ASO KPIs is related to how many people visit your app store listing, whether it’s on Google Play or Apple’s App Store. It’s also essential to know whether those visits come from paid ads or organically.
Time Spent on Page
Along with knowing how many users visit your page listing, you also need to know how much time they spend there. If the majority of users spend just a couple of seconds there and bounce, that means something’s wrong and you need to work more on ASO.
You should study it in relation to conversions. If they’re spending a lot of time on your page, but don’t convert, that’s also a sign that something needs to be improved.
Visitor Engagement and Behavior
This is where you get into the nitty gritty of how users interact with your app store listing. You need to track how many page visitors have interacted with your listing in any way (scrolling, reading more, exploring, tapping the install button). Furthermore, it’s essential to know the number of users who convert, i.e., install your game.
When it comes to user behavior, it goes back to time spent on page. For example, the so-called explorers take time to study an app store listing before deciding to install a game. With those users, you’ll see longer time spent on the page, which hopefully results in a conversion. Other users who are already convinced to install the game – they’ll click the install button immediately, without exploring the store listing.
Screenshot Metrics
There are various metrics related to screenshots. The basic ones are screenshot views, screenshot view rate, and average view duration. All of them are self-explanatory.
However, you can go deeper. For example, the average time before a view tells you how much time users spend on your page before viewing a screenshot. You can also track how many users open screenshots to fullscreen or how many have scrolled through them.
One of the most important KPIs when it comes to screenshots is how many users installed the game after viewing a screenshot. This metric is significant because it shows a direct correlation between screenshots and installs.
App Promo Video Views
Similarly to screenshots, you also need to know how many people view your app promo video and how that relates to installs.
Read More Views
Another interesting page listing engagement metric is how many people click the read more button in order to read more of your description.
Bounced Visitors
There will be many users who end up on your store listing, but don’t interact with it and leave. If that number is high, that means there’s something wrong with your app store optimization strategy.

ASO Keywords
It’s very useful to know which ASO keywords were responsible for players’ discovering and installing your mobile game. That will inform your keyword strategy and you’ll learn which phrases result in the desired user action and are the most profitable in the long run.
You should also track how high you rank in the app stores for each keyword.
Category Ranking
How high your game ranks in the app stores is another thing you need to monitor. The goal, of course, is to rank as high as possible in your category.
Additionally, you might also want to track the rankings of other popular games in your category. It’s always a good idea to keep an eye on your competitors.
Views to Installs
Views to installs is a metric that tells you how many times a user viewed your app store listing before deciding to pull the trigger and install your game. Aim for a low number of views to installs – it means your ASO strategy is effective.
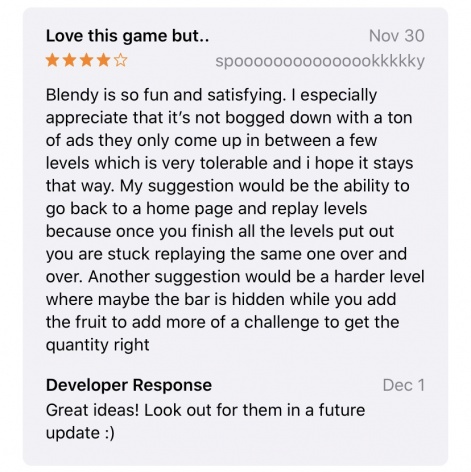
Reviews
A great thing about app stores like Google Play and Apple’s App Store is the ability to leave a review. For developers, this is important feedback that should not be taken lightly.
Positive reviews tell you what you’re doing well and which features players like the most. Negative reviews, on the other hand, tell you what needs to be improved, i.e., how you can make your game better.
Naturally, the more positive reviews your game gets the better, as this will help your ASO efforts. However, the total number of reviews is also important because that shows you how passionate people are about your game.
Also, you must answer each and every review users leave for your game. That shows players that you care and listen to what they have to say.
Ratings
This mobile game KPI is pretty straightforward – just like reviews, the goal is to get positive feedback. The more positive ratings you get, the higher your average ratings will be.
It would be ideal to have 5.0 ratings. However, anything above 4.5 is considered great.

User Experience Mobile Game KPIs
Finally, I’ll go through some essential mobile game KPIs that pertain to user experience, as it’s a big factor in any game’s success.
Load Time
Load time refers to how long it takes for your game to load once the user taps the icon to open it. Furthermore, load time can also refer to the amount of time it takes the user to switch from one screen to another.
If your load time is low, that means your mobile game is fast. The faster your game is, the better the user experience will be.
Simple, right?
Crashes
Another thing that directly affects user experience is how many times your mobile game crashes.
If it happens once or twice, the user might look past it. However, if it happens frequently, that’s a serious issue that negatively impacts user experience.
Devices Used
This is a pretty straightforward mobile game KPI that’s worth defining and monitoring. It’s about which mobile devices players are using to access your mobile game, i.e., tablets or smartphones.
Naturally, your game must work on all mobile devices.
Operating System
You also need to know whether your users use Android or iOS to access your app.
This is useful for many reasons. For example, you might notice a lot of crashes on uninstalls on one of them. That means there’s something wrong and you need to look into it.
Just like on mobile devices, your game needs to work equally well on all operating systems.
Final Thoughts on Mobile Game KPIs
We’ve come to the end of our extensive list of mobile game KPIs.
Here are a few key things to remember.
- Each one of these mobile game KPIs is important in its own way.
- Which key performance indicators you’re tracking and measuring depends on which part of the user journey you want to evaluate.
- Your data must be accurate in order to correctly measure the success of your mobile game


