

In a world where data is king, understanding dashboards is crucial. This article demystifies what a dashboard is, outlines its different types, and provides real-world dashboard examples.
Get ready to learn how data dashboards can streamline your data interaction and enhance your decision-making skills.
Let’s dive in!
Data Dashboard: Definition and Meaning in Business
A dashboard is a tool that aggregates and displays key data metrics and KPIs in a single, easy-to-view interface.
The dashboard meaning in business is about providing a snapshot of performance, trends, and insights that guide decision-making. Think of it as your data command center that offers a concise and updated overview of critical business metrics at a glance.

Dashboard vs Report: What’s the Difference?
Understanding the difference between a dashboard and a report is crucial for effective data management.
Essentially, dashboards give you a snapshot of the “now,” while reports tell the story of “how” and “why” over time.
A dashboard is a visual interface displaying real-time data that offers an interactive and dynamic overview of current performance. It’s designed for at-a-glance monitoring and quick decision-making.
In contrast, a report is a more detailed document providing analysis and insights, often based on historical data. Reports are typically static, in-depth, and used for thorough analysis over longer periods.
Types of Dashboards
Dashboards come in various forms, each serving a specific purpose. Here are some common dashboard categories.
Marketing Dashboards
Marketing dashboards are crucial in the mobile marketing and advertising industry. They track campaign performance, customer or user engagement, and ROI. Data visualization dashboards enable marketers to adjust strategies for optimal impact.

Social Media Dashboards
Social media dashboards are essential for digital marketers. They track engagement, reach, and effectiveness across various social media platforms.

App Performance Dashboards
This is a dashboard tool that tracks key performance indicators for mobile apps, such as user acquisition, app engagement, session length, and retention rates.

Game Analytics Dashboards
For mobile games, analytics dashboards provide insights into player behavior, level completion rates, in-game monetization, and player retention.
Competitive Analysis Dashboards
Competitive analysis dashboards provide insights into competitors’ market positions, strategies, strengths, and weaknesses. They help businesses strategize accordingly.

Market Research Dashboards
Market research dashboards are useful for understanding market trends, customer preferences, and industry dynamics. These reporting dashboards aggregate and display research data and findings.
Content Management Dashboards
Essential for content marketers, content management dashboards track content performance across different platforms, including engagement, reach, and effectiveness of content strategy.

Financial Dashboards
Financial dashboards focus on key financial metrics like revenue, expenses, and profitability, crucial for financial planning and analysis.

Sales Dashboards
Used by sales teams, these dashboards track sales performance, leads, conversion rates, and other sales-related metrics.
Project Management Dashboards
They provide an overview of project status, timelines, resource allocation, and progress towards milestones.
User Experience (UX) Dashboards
UX dashboards focus on how users interact with an app or game, and metrics like user journeys, screen flows, and usability issues.

Customer Service Dashboards
These dashboards track customer support metrics, such as response times, satisfaction levels, and resolution rates.

IT Dashboards
An IT dashboard software tracks technology infrastructure performance, including system health, network performance, and security alerts.
Business Dashboards Examples
Here are some examples of popular data dashboards.

Google Dashboard
Google’s dashboard, primarily known as Google Analytics, is a powerful tool for businesses and marketers to understand website performance. It provides insights into website traffic, user behaviors, and demographics.
Key features include real-time data, audience analytics, acquisition sources, behavior on the site, and conversion tracking. It’s an invaluable resource for enhancing online presence and marketing strategies
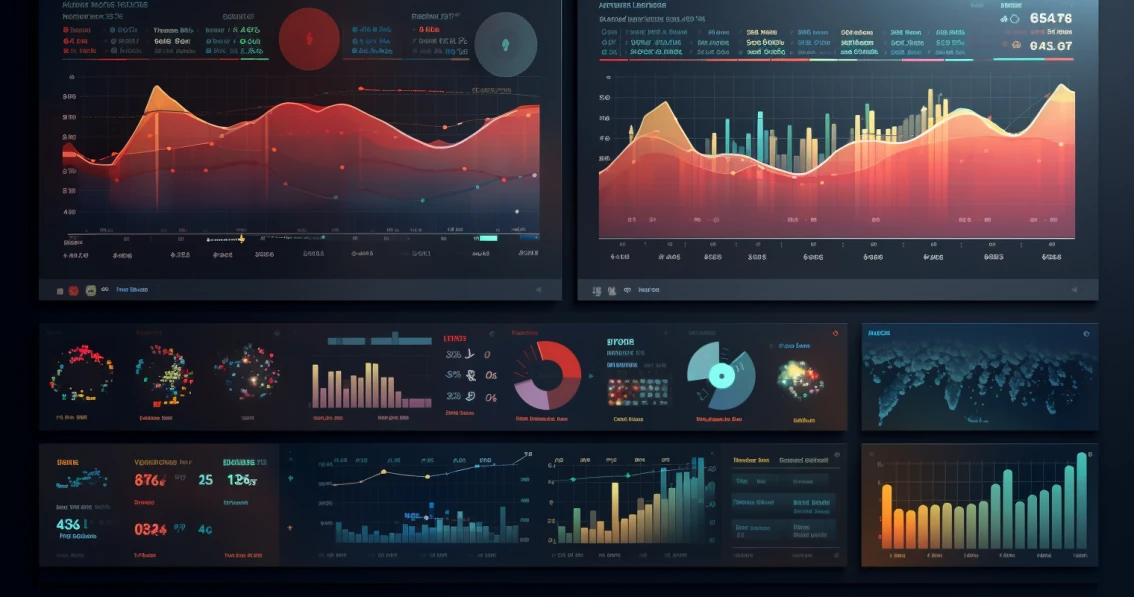
Udonis Marketing Dashboards
With Udonis dashboards, you can track a variety of mobile app and game data. That includes app metrics like daily active users, player retention and session time, marketing data such as CPI and conversion rate, attribution data to understand user acquisition sources, and much more!
Udonis dashboards consolidate data from various sources into a single, user-friendly interface. This comprehensive approach ensures that all critical aspects of your mobile products are under close observation for optimized performance.
Built with the end user in mind, our dashboards simplify data analysis, and eliminate the need to sift through extensive data in spreadsheets.

Square Dashboard
The Square Dashboard is a business tool primarily used by retailers and service providers who utilize Square for payment processing.
It offers a comprehensive view of sales data, customer interactions, and inventory management. This dashboard is particularly useful for businesses looking to streamline their sales and customer management processes.

Meraki Dashboard
Cisco’s Meraki Dashboard is designed for IT management. It provides a centralized view of network operations and offers insights into network performance, user behavior, and device management.
Overall, it’s a great tool for businesses with complex IT infrastructure.
How to Create a Dashboard?
Learn how to create a dashboard and visualize all of your important data.
1. Choose the Best Dashboard Software
The first and crucial step is selecting the right dashboard tool for your business needs. A good dashboard tool should offer user-friendly design options, flexibility in handling different data sources, and customization capabilities.
We recommend Udonis Dashboards for its comprehensive features, ease of use, and adaptability to various business requirements.
It allows you to integrate diverse data sets and customize dashboards to fit your specific business insights and decision-making processes. It is particularly useful for mobile apps and games.
2. Define Your Audience
Think about who in your business will use the dashboard. Is it for your marketing team, sales department, or management?
Understand their specific needs and goals.
For example, your sales team might need quick access to lead conversion rates, while management might be more interested in overall revenue trends.
3. Examine Your Data
Look at the data you already have. Is it up-to-date and reliable?
Ensure the data is relevant to the goals of your dashboard users. For instance, if you’re tracking marketing campaign effectiveness, you’ll need data on engagement metrics and customer demographics.

4. Select the Right Chart Types
Choose charts that best represent your data. Line charts are great for showing trends over time, while bar charts can be used for comparing different groups or categories.
The key is to make the data as easy to understand at a glance as possible.
5. Use Effective Color Combinations
Select colors that are easy to differentiate and consider users who might be colorblind.
Colors should enhance the data’s readability, not distract from it.
For instance, use contrasting colors for different data sets in a bar chart.
6. Include Diverse Perspectives
Combine historical data, current performance metrics, and future projections. This approach provides a well-rounded view, helping in strategic decision-making.
For instance, include last year’s sales data, current year trends, and forecasted figures.
7. Leverage Data Visualization Templates
If you’re not sure where to start, use pre-made dashboard templates. They can be a great source of inspiration and can be customized to fit your specific needs. Look for templates that are easily adaptable to your business’s data structure and objectives.
8. Regularly Update and Maintain Your Dashboard
Dashboards should not be static. Regularly update your dashboard with the latest data and make adjustments as your business goals and environments change. This keeps the dashboard relevant and useful.
9. Train Your Team
Ensure that everyone who needs to use the dashboard understands how to do so effectively. This might involve training sessions or creating user guides to help them interpret the data correctly and make informed decisions.
Final Thoughts on Data Dashboards
Data dashboards are crucial in today’s business environment. They provide a real-time overview of vital metrics and are indispensable for informed decision-making.
If you need assistance in harnessing the full potential of data dashboards for your business, don’t hesitate to reach out to us for expert help.


Comments