Unlocking the secrets of user behavior, optimizing app performance, and unleashing the full potential of your mobile app requires a powerful ally: mobile app analytics tools.
In the mobile app market, understanding user interactions, measuring KPIs, and making data-driven decisions have become key for success. But with a sea of options flooding the market, finding the best mobile app analytics tools and platforms can be a daunting task.
Fear not!
We’ve curated a definitive guide to the top mobile app analytics tools that will empower you with insights and catapult your app to new heights.

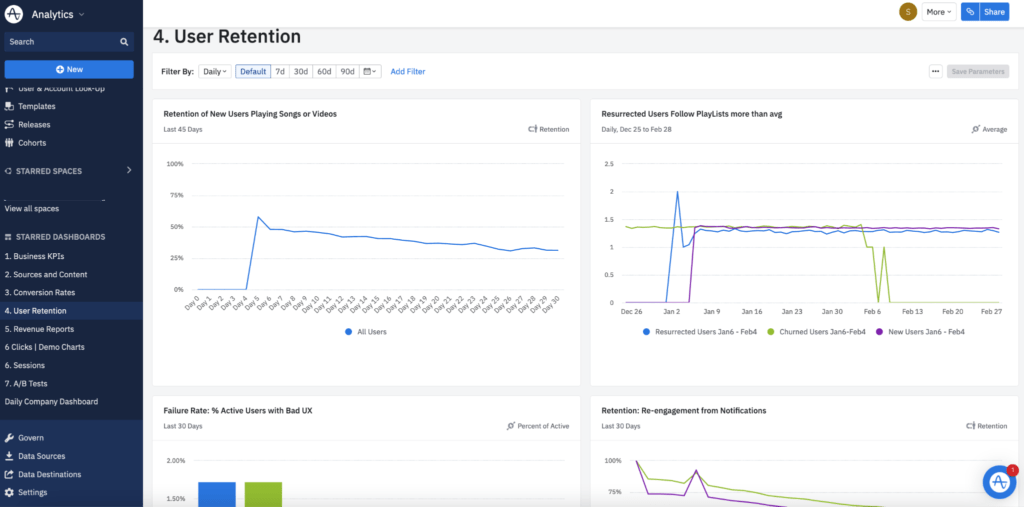
1. Google Analytics 4
Google Analytics is one of the most powerful mobile app analytics tools. It provides a comprehensive set of features and insights to aid mobile app publishers, developers, and marketers in optimizing your app’s performance and enhancing user experiences.
With its robust capabilities and user-friendly interface, Google Analytics enables data-driven decision-making, helping you thrive in the dynamic mobile app ecosystem.
Tracking Metrics
One of the key strengths of Google Analytics lies in its ability to track and measure various app-related metrics from app downloads, user retention, and session duration to in-app purchases, event tracking, and conversion rates. This allows you to gain a deep understanding of user behavior and engagement.
Audience Insights
What’s more, Google Analytics equips you with detailed audience insights, which makes it easy to segment users based on demographics, interests, and behaviors. By comprehending your app’s user base more comprehensively, you can tailor marketing strategies and optimize user acquisition campaigns, ultimately driving higher engagement and revenue.
Real-Time Data
By integrating the Google Analytics SDK into your apps, you gain access to real-time data on crashes, exceptions, and user flow. This deep level of monitoring empowers you to identify and address performance issues promptly, ensuring a smooth and glitch-free user experience.
The tool’s granular reports provide invaluable insights into app version performance, device compatibility, and network latency.
Attribution
For app marketers, Google Analytics offers an array of features to measure and optimize campaigns. With robust attribution modeling, marketers can accurately assess the impact of various marketing channels on app installations and conversions. That leads to allocating resources more wisely and maximizing return on investment (ROI).
By integrating with other Google tools, such as Google Ads and Firebase, marketers can seamlessly synchronize data and unlock additional marketing insights.
But more on Firebase in the following section.

2. Firebase
Firebase, developed by Google, is a versatile mobile app analytics and development platform that offers a wide range of features.
With its analytics capabilities, real-time insights, and seamless integration with other Google services, Firebase provides a comprehensive solution for optimizing app performance, driving user engagement, and gamifying apps.
User Data
Firebase Analytics, a core component of the Firebase platform, offers powerful and easy-to-use mobile app analytics. It provides detailed data on user behavior, demographics, user flows, and conversion rates, which enables app publishers to gain a comprehensive understanding of how users engage with your app.
With Firebase Analytics, you can measure key performance indicators, identify trends, and make data-driven decisions to optimize user experiences, enhance retention rates, and drive app growth.
Real-Time Analytics
Real-time analytics is a standout feature of Firebase, allowing you to monitor app performance and user behavior as it happens. The real-time data and insights enable making immediate responses to changes.
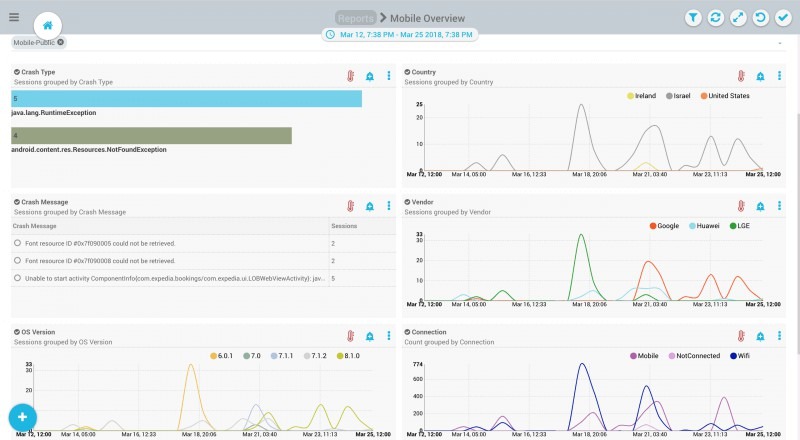
Firebase Crashlytics
Firebase Crashlytics provides powerful crash reporting and analysis, allowing developers to identify and resolve issues that affect app stability. By tracking crashes, exceptions, and performance issues, Firebase Crashlytics provides actionable insights that help improve app performance and minimize user churn.
This error reporting and debugging capability is perfect for streamlining debugging processes, which leads to faster app iterations and improved app quality.
Integrations
Firebase integrates seamlessly with other Google services, which unlocks additional capabilities. For example, integration with Google Ads enables you to track campaign effectiveness, measure conversion rates, and optimize ad spend. Integration with Google Cloud Platform provides scalable infrastructure and advanced data processing capabilities for handling large-scale data analytics.
These integrations offer a holistic view of an app’s performance and enable app developers to leverage the full potential of Google’s ecosystem for app success.

3. Singular
Singular is one of the most feature-rich mobile app analytics tools. It’s designed to empower mobile app publishers to analyze and optimize your app’s performance.
This analytics tool offers an extensive suite of features that covers every aspect of mobile app analytics. For example, understanding user behavior, tracking marketing campaigns, and identifying areas for optimization.
Attribution Tracking
One of the key features of Singular is its robust attribution tracking. It provides a comprehensive view of the customer journey, which allows marketers to accurately attribute app installations and in-app events to specific marketing channels. This granular level of attribution helps you understand which channels are driving the highest-quality users and enables them to allocate resources effectively for maximum impact.
Cohort Analysis
In addition to attribution, Singular offers comprehensive cohort analysis. This feature allows you to segment users based on specific criteria, such as acquisition source, demographics, or behavior patterns.
It can uncover valuable insights that improve user experiences and optimize monetization strategies.
A/B Testing
Singular’s A/B testing capabilities are another noteworthy aspect of the tool. It enables you to run controlled experiments to compare different versions of your app, marketing campaigns, or user experiences.
By analyzing the impact of these variations on key metrics, such as conversion rates or revenue per user, you can make data-backed decisions to optimize your app’s performance and drive better results.
Fraud Prevention
The fraud prevention feature offered by Singular is essential in today’s mobile app ecosystem. It employs advanced algorithms and machine learning techniques to identify and mitigate fraudulent activities, such as fake installs or ad fraud.
Deep Linking
Singular also offers deep linking capabilities that allow you to route users to specific app screens or content based on your referral source or marketing campaign. This feature enhances user engagement and streamlines the user journey, leading to improved conversion rates and higher user satisfaction.
Reporting
Singular provides a comprehensive suite of reporting and visualization tools. It offers customizable dashboards and real-time reporting that make it easy to monitor key performance indicators (KPIs).

4. Adjust
Adjust is a leading mobile app analytics tool that offers plenty of features for optimizing app performance.
These are the features that make it worth checking out.
Attribution
An advanced attribution tracking system is Adjust’s core feature. It attributes installs, as well as specific app events to marketing campaigns and channels.
Adjust also goes beyond basic attribution tracking by offering advanced features like cohort analysis. This feature allows you to segment users based on various criteria, such as acquisition source, demographics, or user behavior.
Analytics and Reporting
In addition to attribution and cohort analysis, Adjust’s analytics tools enable you to measure and analyze KPIs with precision. On top of that, it has an intuitive reporting interface and customizable dashboards that offer real-time insights into user engagement, revenue, conversion rates, and user retention.
Integration
You can also connect to and consolidate data from various sources, including other analytics tools, marketing platforms, and data platforms. This seamless integration helps you gain a holistic view of your app’s performance and enables them to make data-driven decisions based on comprehensive and unified data sets.
The platform’s SDKs further enhance flexibility, allowing you to customize and extend its features to meet your specific needs.

5. AppsFlyer
AppsFlyer is a leading mobile app analytics tool that specializes in attribution tracking and marketing analytics. With its advanced features, AppsFlyer empowers mobile app publishers to gain deep insights into app performance and optimize marketing campaigns for maximum impact.
Marketing Analytics
AppsFlyer’s reporting and analytics dashboard provides in-depth insights into key performance indicators (KPIs), including user retention, revenue, conversion rates, and lifetime value (LTV).
These insights allow you to evaluate the effectiveness of your campaigns, optimize user experiences, and identify growth opportunities.
Attribution
In addition to analytics, AppsFlyer offers attribution tracking. It accurately attributes app installs, in-app events, and user engagement to specific marketing channels, campaigns, and even individual ad creatives.
This comprehensive and granular attribution data enables you to measure the effectiveness of your marketing efforts.
But, AppsFlyer’s attribution goes beyond traditional last-click attribution models. It employs advanced algorithms and methodologies, such as multi-touch attribution, to attribute credit to the most relevant touchpoints in the user journey. This level of attribution granularity is perfect for understanding the full customer journey.
Integration
AppsFlyer seamlessly integrates with a wide range of marketing platforms, ad networks, and analytics tools. That way, you can consolidate your data and gain a comprehensive view of your app’s performance.

6. GameAnalytics
GameAnalytics is an analytics tool specifically designed for game developers, which makes it unique on this list. Its features make it easy to understand player behavior, optimize game design, and drive player engagement.
Player Behavior
GameAnalytics provides detailed analytics on player behavior and key metrics such as player retention, engagement, monetization, and in-game progression. Understanding how players interact with your games is key because it helps you identify areas for improvement, optimize game mechanics, and enhance player experiences.
What’s more, GameAnalytics’ data can make it easier to create engaging gameplay loops, balance difficulty levels, and design personalized experiences tailored to your player base.
Event Tracking
With GameAnalytics, you can also track and analyze a wide range of player actions, events, and interactions within your games. This includes tracking specific in-game events, such as level completion, item purchases, or social interactions.
Real-Time Data
Real-time data tracking is a key strength of GameAnalytics – it allows you to monitor player activity and game performance in real time.
That way, you can quickly identify and respond to issues, tweak gameplay mechanics, and adapt your strategies in real-time to optimize player experiences. You can also set up custom alerts and notifications to stay informed about critical events or changes in player behavior.
Reports and Custom Dashboards
Another useful feature of this mobile game analytics platform is customizable and interactive reports. You can create tailored dashboards and visualizations to monitor KPIs relevant to your game.
These reports provide a comprehensive view of player behavior, monetization trends, user acquisition, and game performance metrics. With the ability to drill down into specific data points, you can identify trends and track the effectiveness of updates or changes.
7. Amplitude
Amplitude is another excellent mobile analytics tool, perfect for app developers and marketers who require lots of data. The following features stand out.
User Behavior Tracking
By integrating Amplitude’s SDK, developers can collect valuable data points such as user actions, events, and screen views. This data allows you to gain deep insights into user interactions, preferences, and engagement patterns, ultimately driving informed product decisions and optimization strategies.
Funnel Analysis
Amplitude’s funnel analysis feature helps you understand and optimize user conversion flows. Funnel visualization is perfect for identifying drop-off points in the user journey, which then allows you to implement the necessary improvements to enhance conversion rates.
Cohort Analysis
With Amplitude’s cohort analysis, you can group users based on specific criteria, such as acquisition date or user behavior. This allows for comparative analysis between different cohorts, which provides insights into important metrics related to user retention, engagement, and revenue.
Revenue Analytics
For monetized apps, Amplitude offers revenue analytics. With this feature, you can track and analyze revenue metrics such as average revenue per user, user lifetime value, ad revenue, and more.
You can use this valuable data to optimize monetization strategies and pricing models to maximize revenue.
8. Glassbox
Glassbox is a mobile app analytics tool that can help you optimize the user experience. With its comprehensive tracking capabilities, session replay functionality, and powerful analysis tools, Glassbox empowers you to understand user interactions, identify pain points, and enhance app performance.
Here’s some more info about these standout features.
User Sessions Analysis
This mobile analytics tool allows you to capture and analyze user sessions in real time. More specifically, it records user interactions, including taps, swipes, and gestures, which makes up a detailed view of how users navigate through the app.
User Behavior Analytics
With Glassbox, you can also analyze user behavior at both a macro and micro level. You’ll get detailed reports on key metrics such as session duration, session length, playtime, user flow, and conversion rates.
Additionally, it offers decent filtering and segmentation options.
Heatmaps
Glassbox’s heatmaps feature is a visual representation of user interactions – it highlights the areas of high and low engagement within the app.
This is a useful feature because it tells you which app elements attract the most attention and which may be overlooked. Knowing that allows you to optimize the placement of important features, buttons, or calls-to-action to enhance user engagement and drive desired actions.
Error Detection
Another notable Glassbox feature is the error and anomaly detection. The platform automatically detects and alerts you to errors, crashes, or unusual behavior within the app.

9. CleverTap
CleverTap is a mobile app analytics platform with personalization and automation features.
Here’s what you need to know about it.
Analytics
Like other mobile app analytics tools on this list, CleverTap also analyzes how users interact with your app and measures key metrics such as user engagement, retention, conversion rates, and revenue.
Omnichannel Messaging
What makes CleverTap unique is its omnichannel messaging feature, which enables you to engage with users across multiple communication channels, including push notifications, email, SMS, in-app messaging, and web push.
Personalization
The AI-driven personalization capabilities of CleverTap leverage machine learning algorithms to deliver personalized recommendations, content, and experiences to users.
This level of personalization enhances user engagement, drives conversions, and fosters long-term user loyalty.
Automation
CleverTap’s automation features enable you to create customized user journeys based on specific triggers or events. For example, you can send a welcome message to new users, trigger a reminder for abandoned carts, or offer a special promotion for loyal customers.
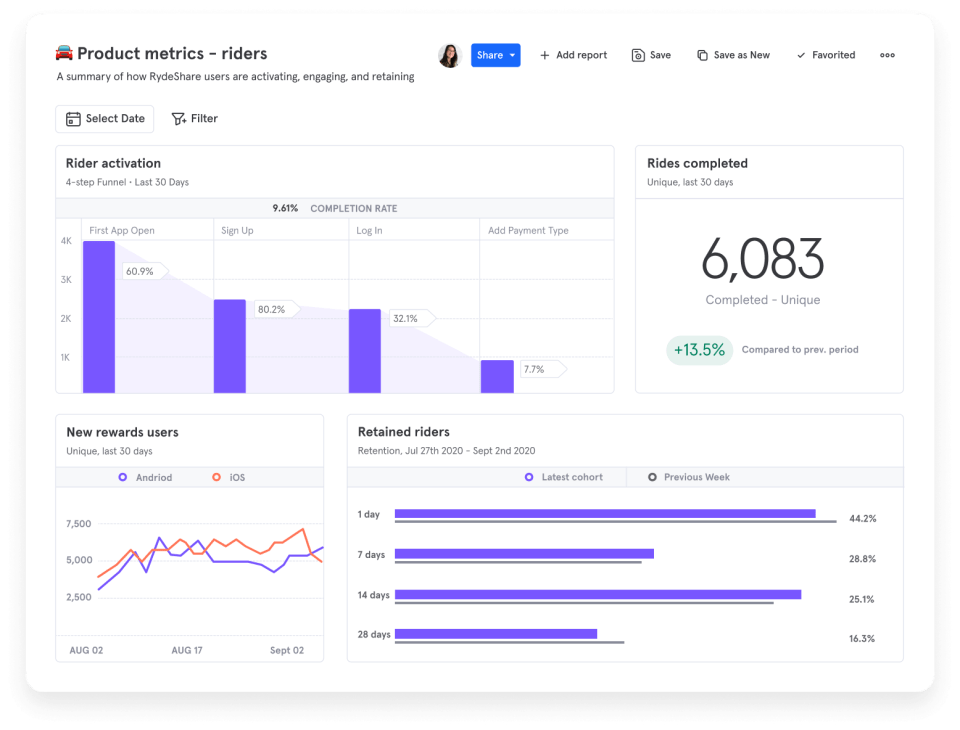
10. MixPanel
MixPanel’s focus is on behavioral analytics, real-time tracking, and customizable reports.
Here’s a quick overview of its main features.
User Analytics
With MixPanel, you can track how users engage with certain app features, perform specific actions, and navigate through the app. This deep understanding of user behavior helps identify bottlenecks, optimize user flows, and improve overall user experiences.
Real-Time Analytics
Real-time tracking is another key strength of MixPanel.
It’s perfect for making time-sensitive decisions, monitoring key metrics, identifying trends, and quickly responding to changes.
Another interesting use of this feature is to set alerts for real-time data so that you get notified when conversion rates go down, for example.
Segmentation
MixPanel’s segmentation feature lets you analyze user groups based on specific criteria, such as demographics, user attributes, or behaviors.
Doing this has several benefits. For example, you can personalize user experiences, tailor marketing campaigns, and improve app monetization.

11. Kochava
Kochava is another leading mobile app analytics and attribution platform that can help you optimize user acquisition strategies and drive measurable results.
Here are its standout features.
Attribution
Kochava’s attribution tracking feature tells you which marketing campaign, creative, or channel is responsible for certain installs, events, or user actions.
What sets Kochava apart is its ability to offer precise attribution across various channels and platforms, including mobile, web, and connected TV. This multi-channel attribution allows you to understand the full customer journey and accurately attribute conversions, whether it’s a mobile ad, website visit, or TV ad.
Analytics Reporting
Kochava’s reporting interface and customizable dashboards provide in-depth insights into KPIs such as user engagement, revenue, conversion rates, and lifetime value (LTV). With real-time data and visualizations, you can easily track the impact of your marketing activities and identify areas for improvement.
Why Is Mobile Analytics So Important for App Publishers?
To finish off this article, here’s a reminder of why mobile app analytics is essential for app developers, publishers, and marketers.
Understanding User Behavior
Mobile analytics enables app publishers to gain a deep understanding of how users interact with an app and provides insights into engagement patterns, session duration, session length, and conversion rates.
Knowing all that helps improve the functionality of an app, deliver a premium experience, and ultimately drive revenues.
User Acquisition and Marketing ROI
Analytics is also essential for marketing.
With data on user acquisition channels, marketing campaigns, and user acquisition costs, you can focus on campaigns and channels that bring the best results and maximize ROI.
Delivering Personalized User Experiences
With mobile app analytics, you can segment users based on demographics, behaviors, and preferences and deliver personalized experiences, targeted messaging, and customized content.
Boosting App Monetization
You can also get insights into revenue-generating activities within the app, such as in-app purchases, subscriptions, or ads, and use it to tweak offers, ad frequency, messaging, etc.
Iterative App Development
Another benefit of mobile analytics tools is the ability to monitor user feedback, ratings, and reviews and make iterative improvements to your app. That way, users will be satisfied and loyal, which translates to good retention rates.
Competitive Advantage
Finally, in a highly competitive app market, analytics provides app publishers with a competitive advantage. Having an understanding of user preferences, industry benchmarks, and emerging opportunities gets you ahead of the competition.